Project Goal
Analyze a user's understanding and journey within a conferencing tool that was recently acquired and produce a visual that would allow stakeholders to develop a feature roadmap prior to release.
The Ask
Deliver a map that defined how a user would move through the experience
The Ask
Deliver a map that defined how a user would move through the experience
The Users
Small to medium businesses
Small to medium businesses
Project Details
Team (2): UX designer, UX researcher
Role: UX designer (and research support)
Timeline: 4 months
Main tools: Airtable, Figma, Miro
Team (2): UX designer, UX researcher
Role: UX designer (and research support)
Timeline: 4 months
Main tools: Airtable, Figma, Miro
Discovery Goal
Gather insights from customers to identify successes and challenges in the user experience
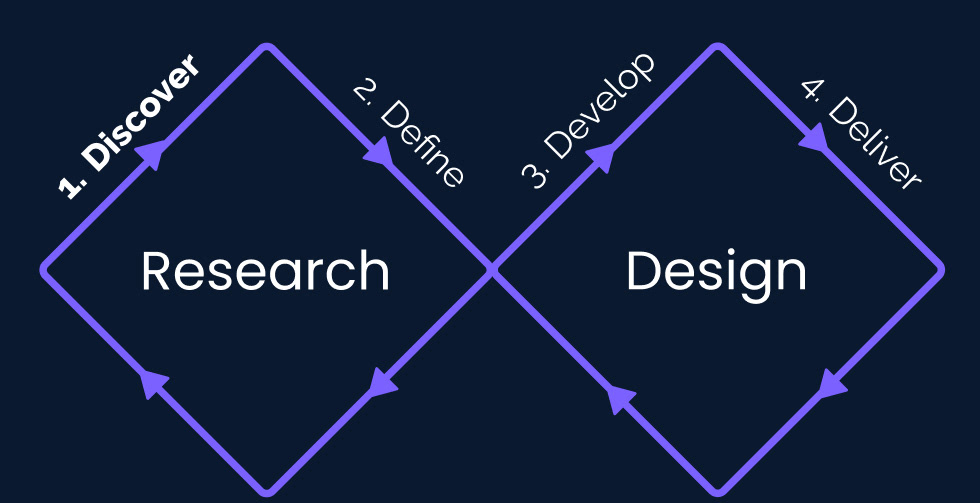
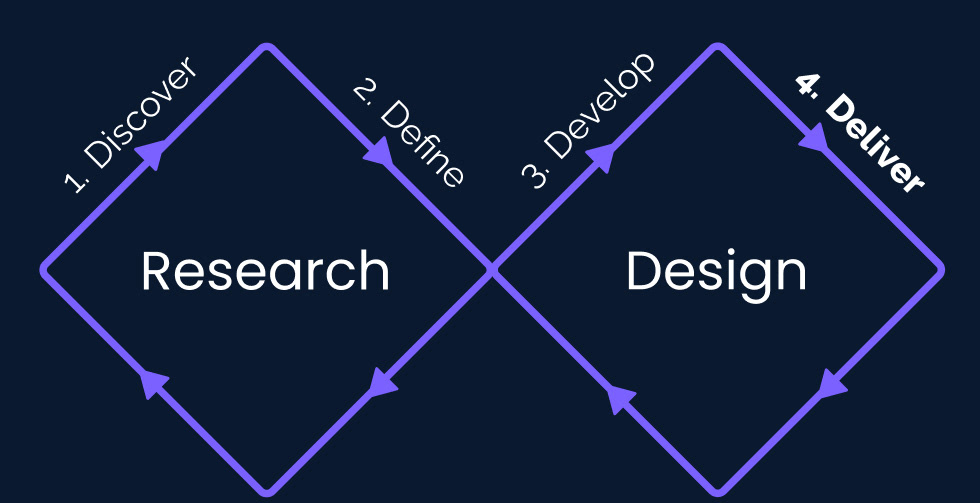
Overarching Process
Conduct a UX inventory and heuristic evaluation to better understand the structure
Conduct competitive analyses of similar experiences
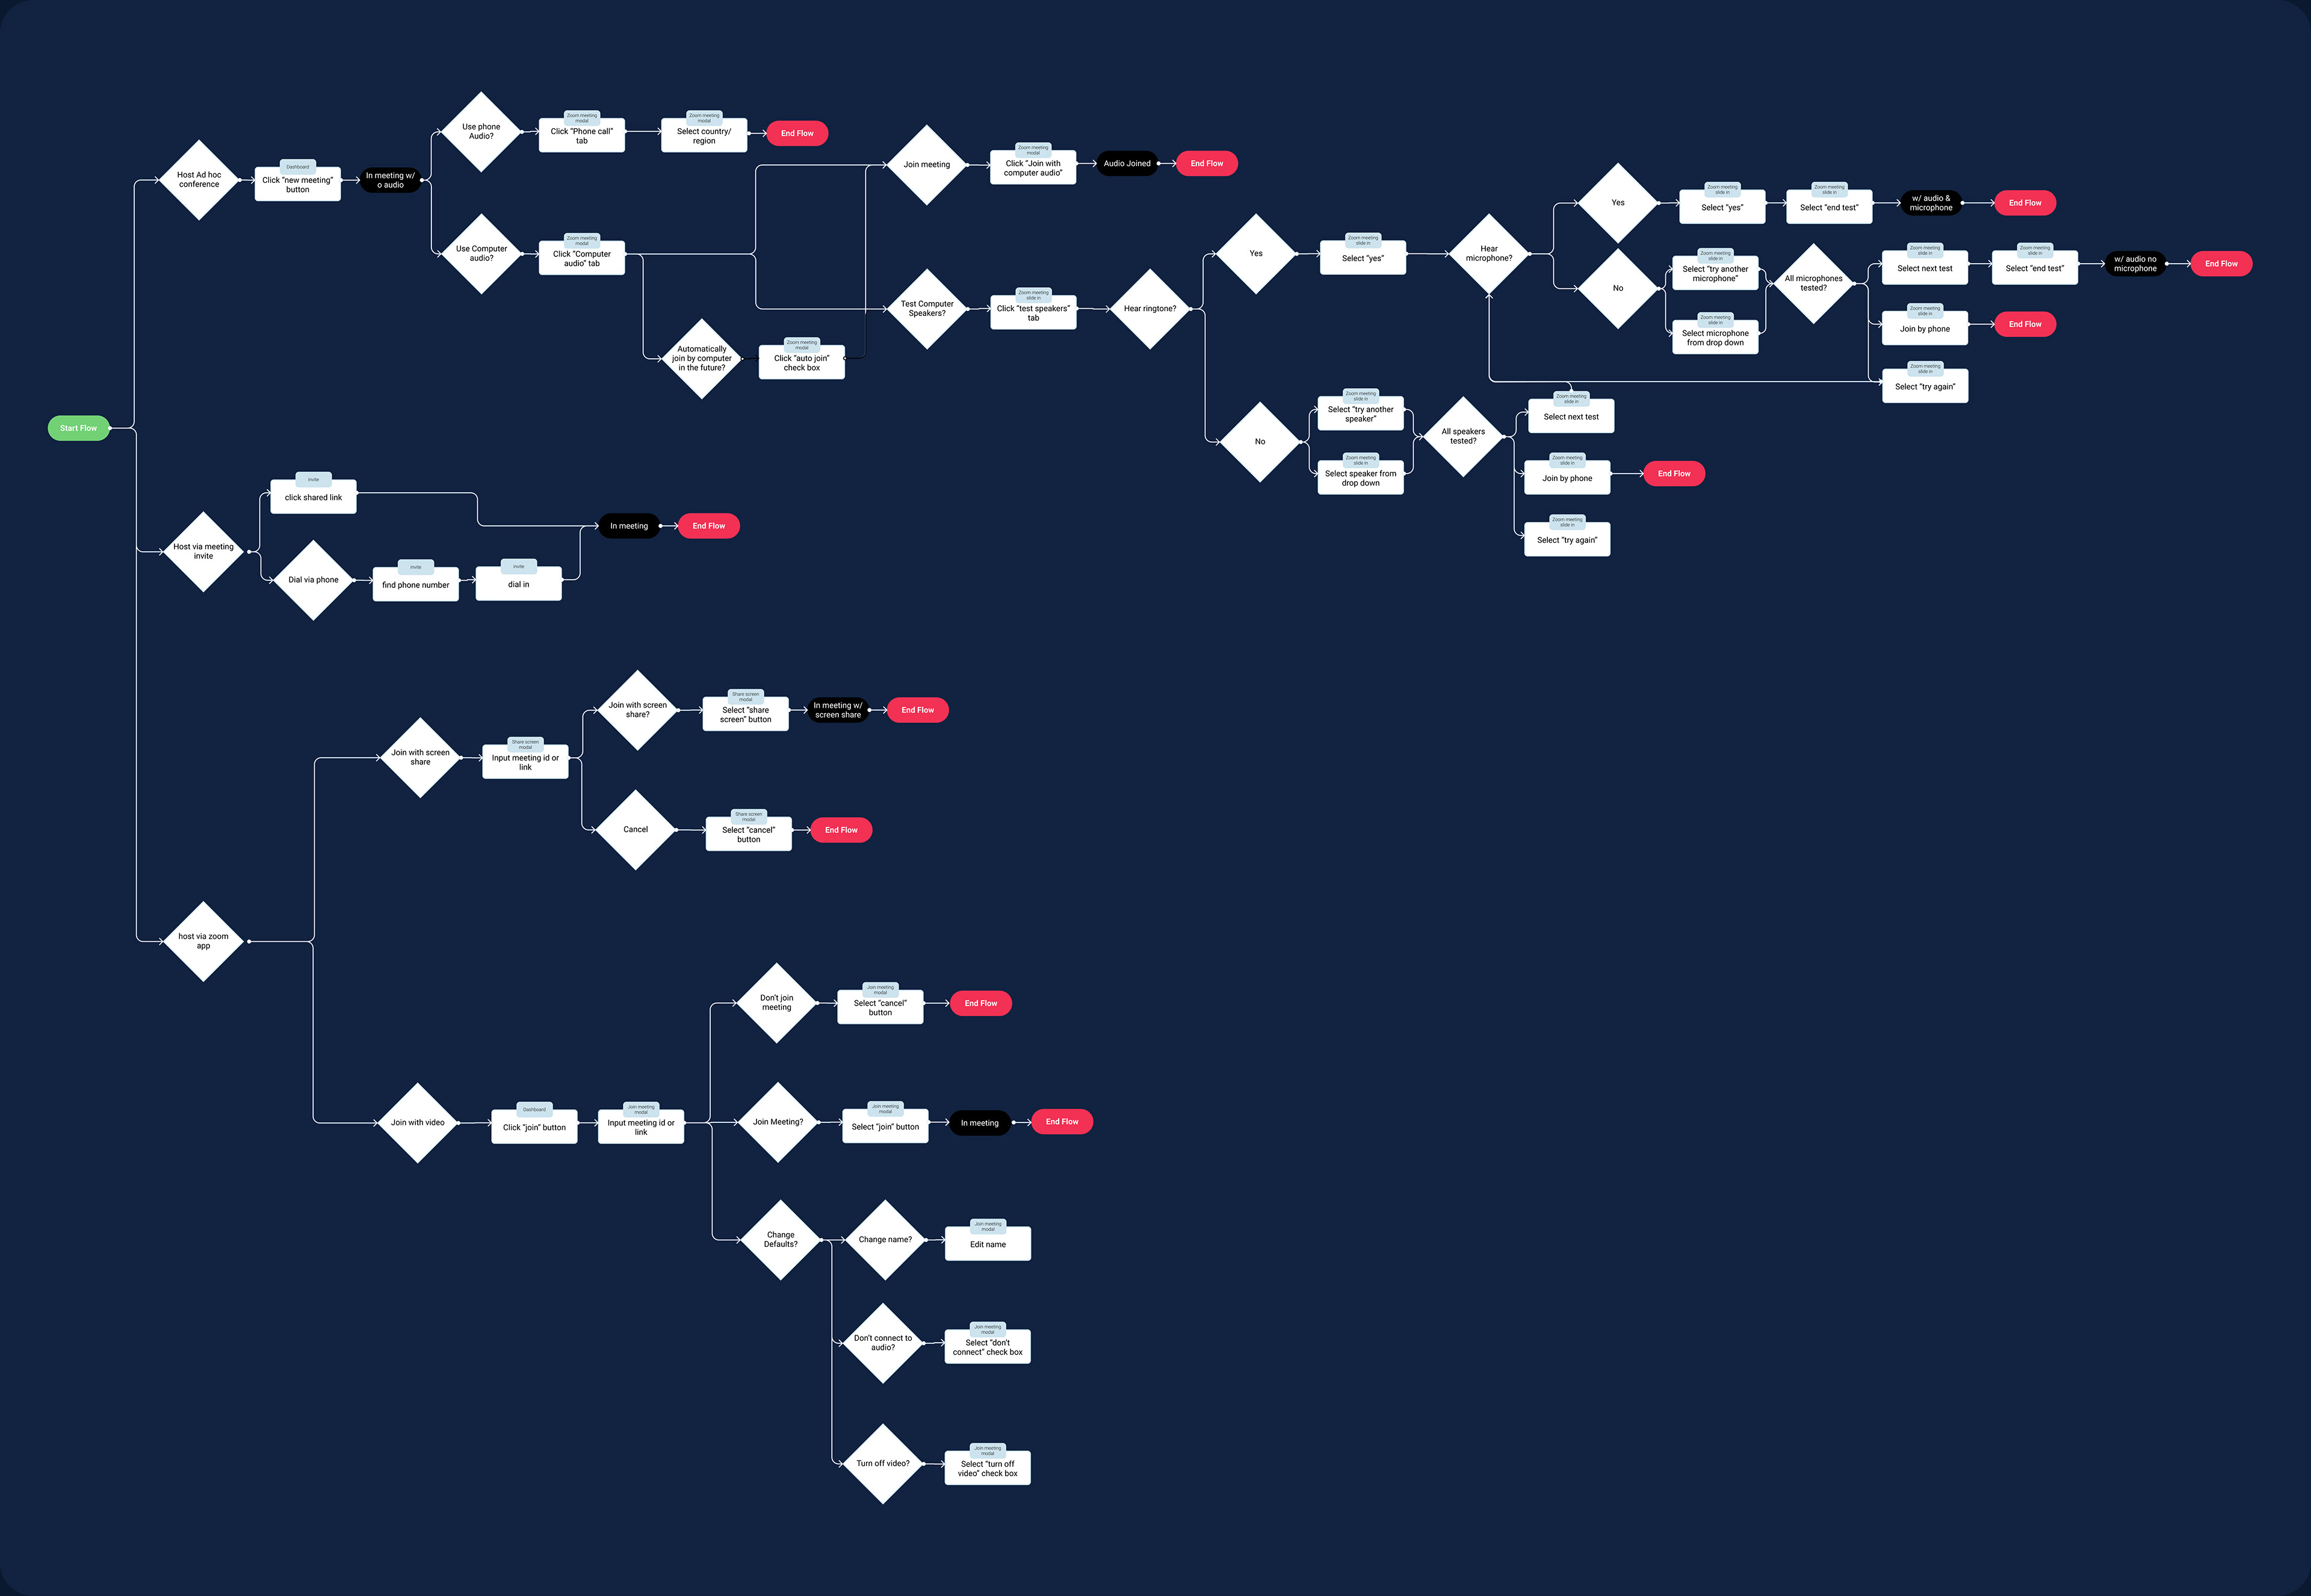
Map out all of the flows for a comprehensive view
Host a diary study to analyze users move through the experience
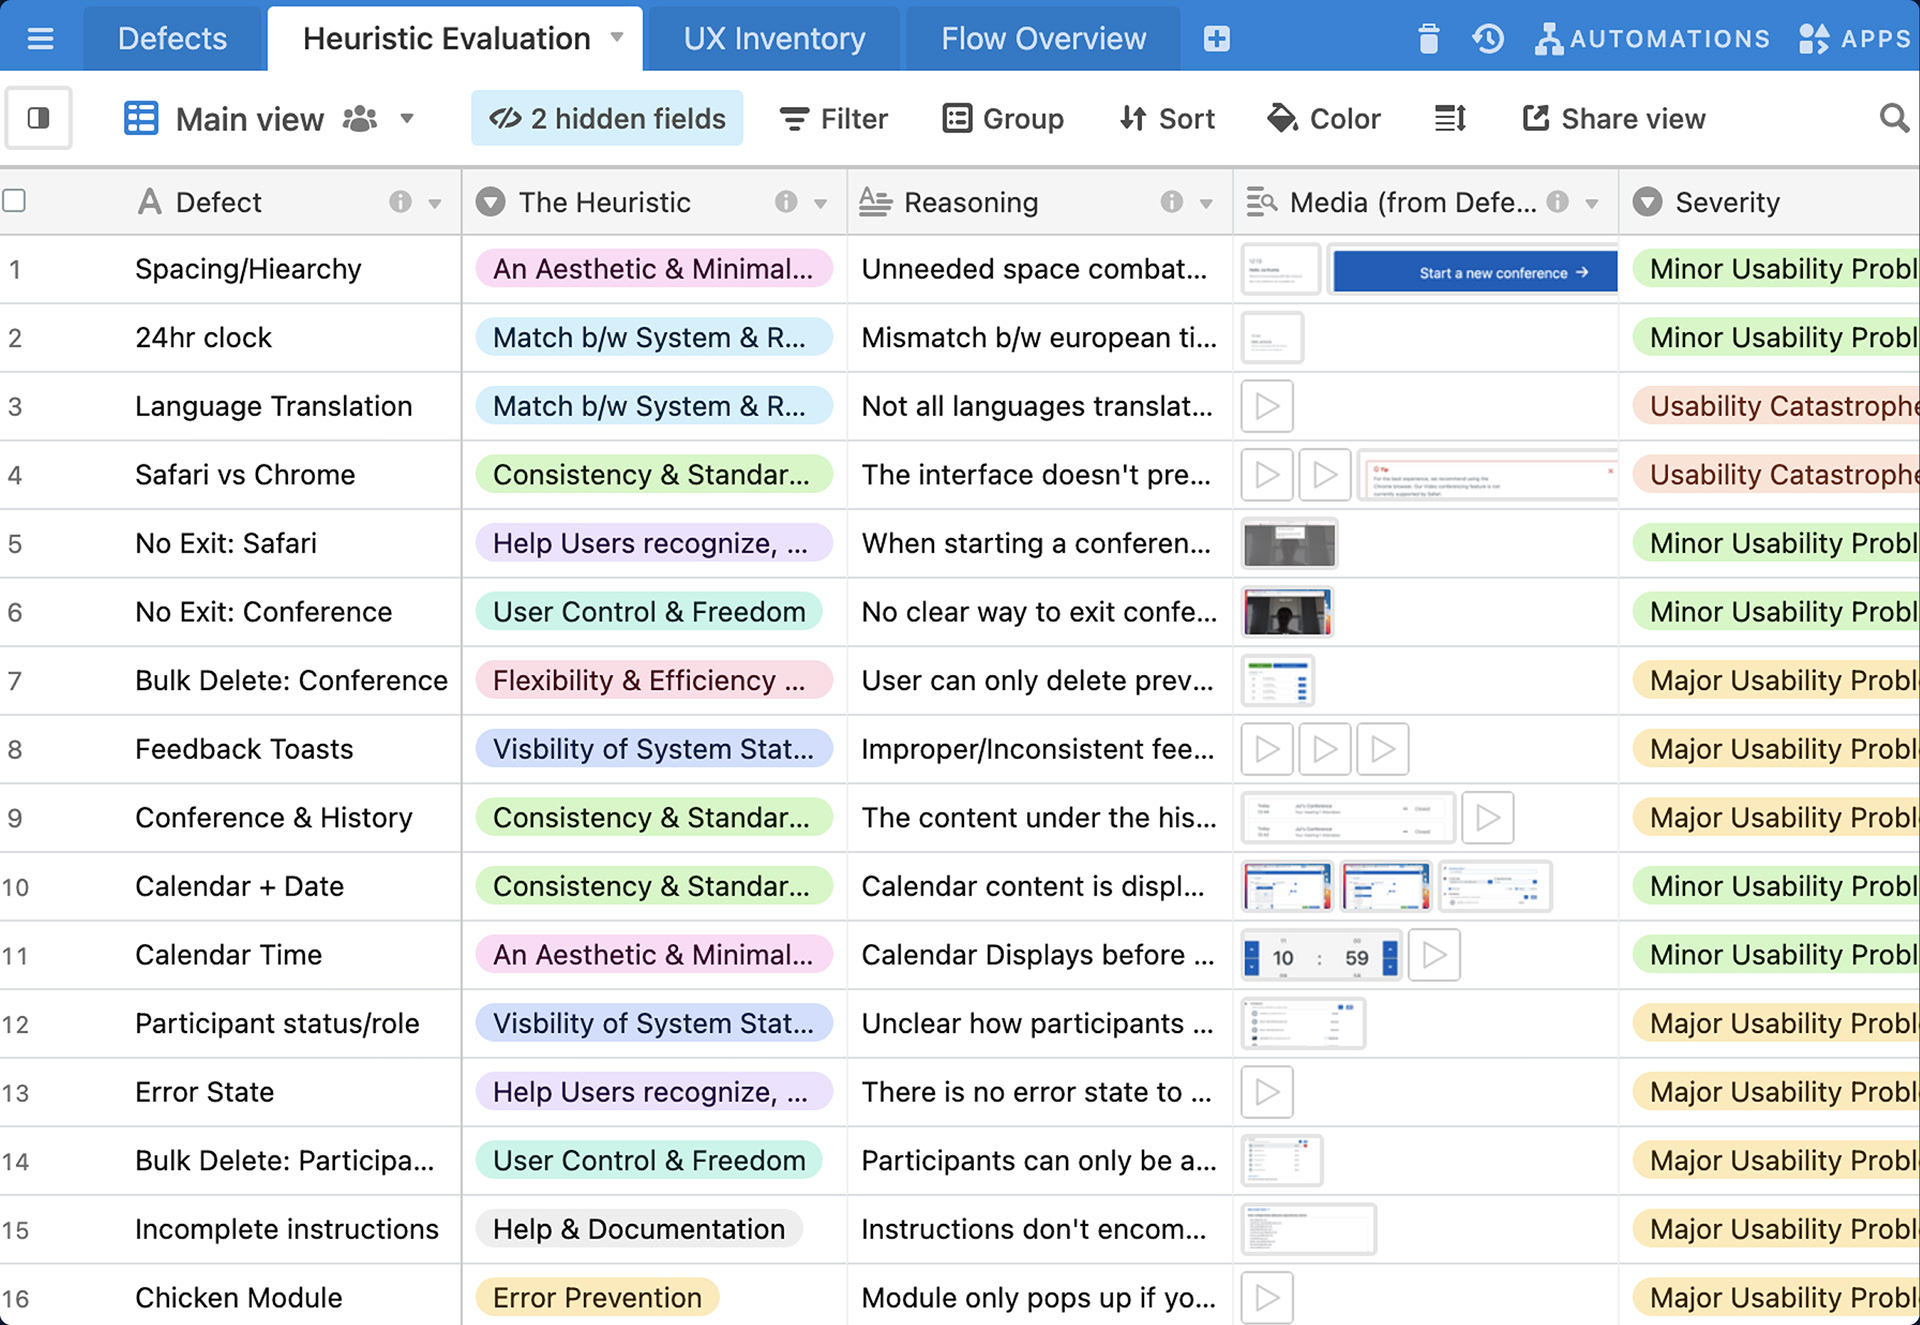
Heuristic Evaluation of inventory
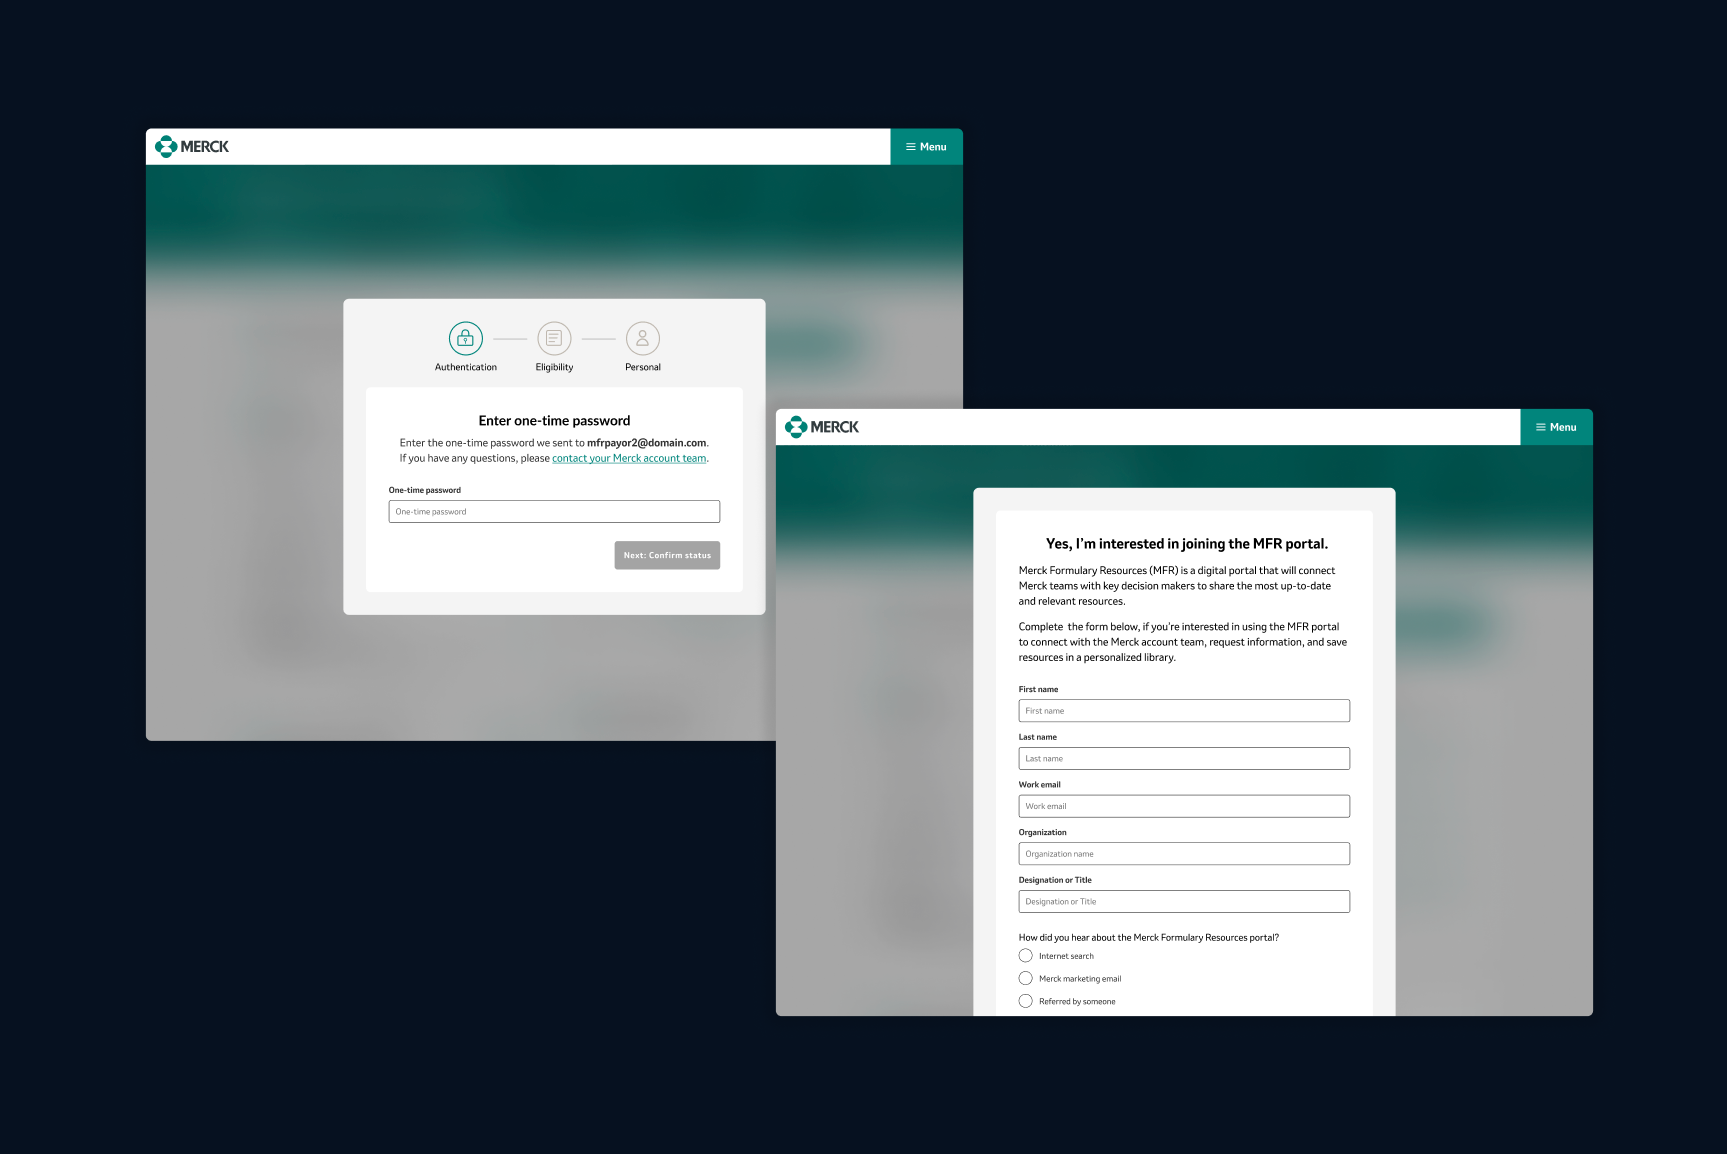
A map of a competitor experience
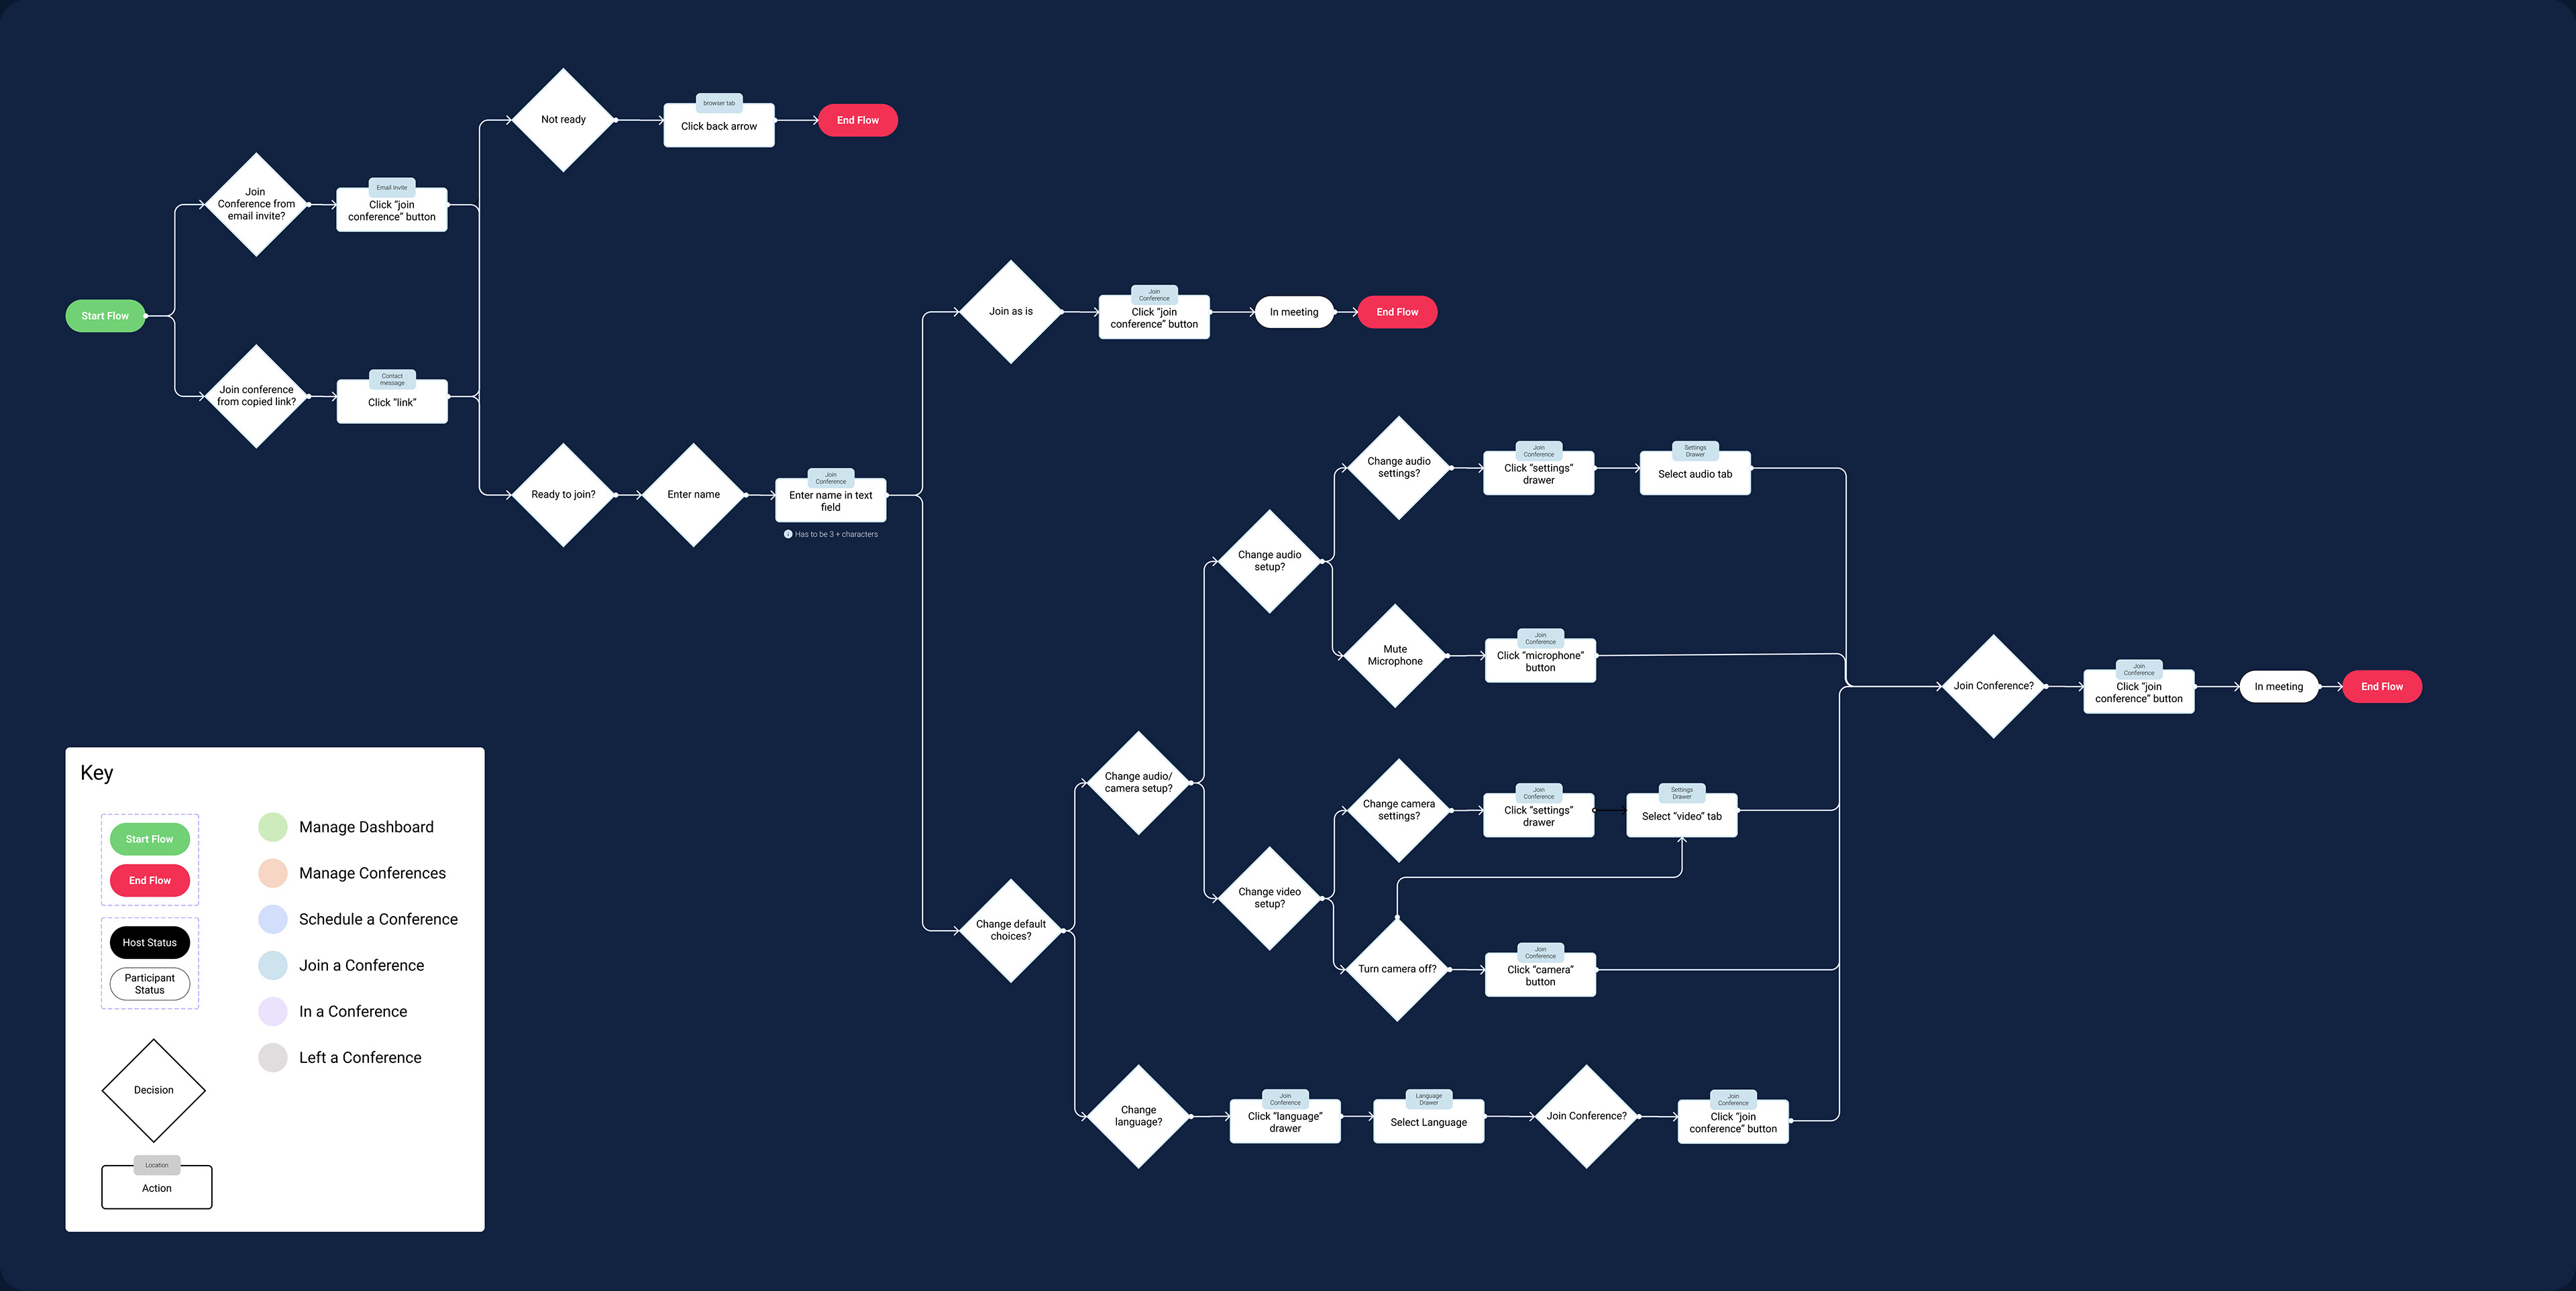
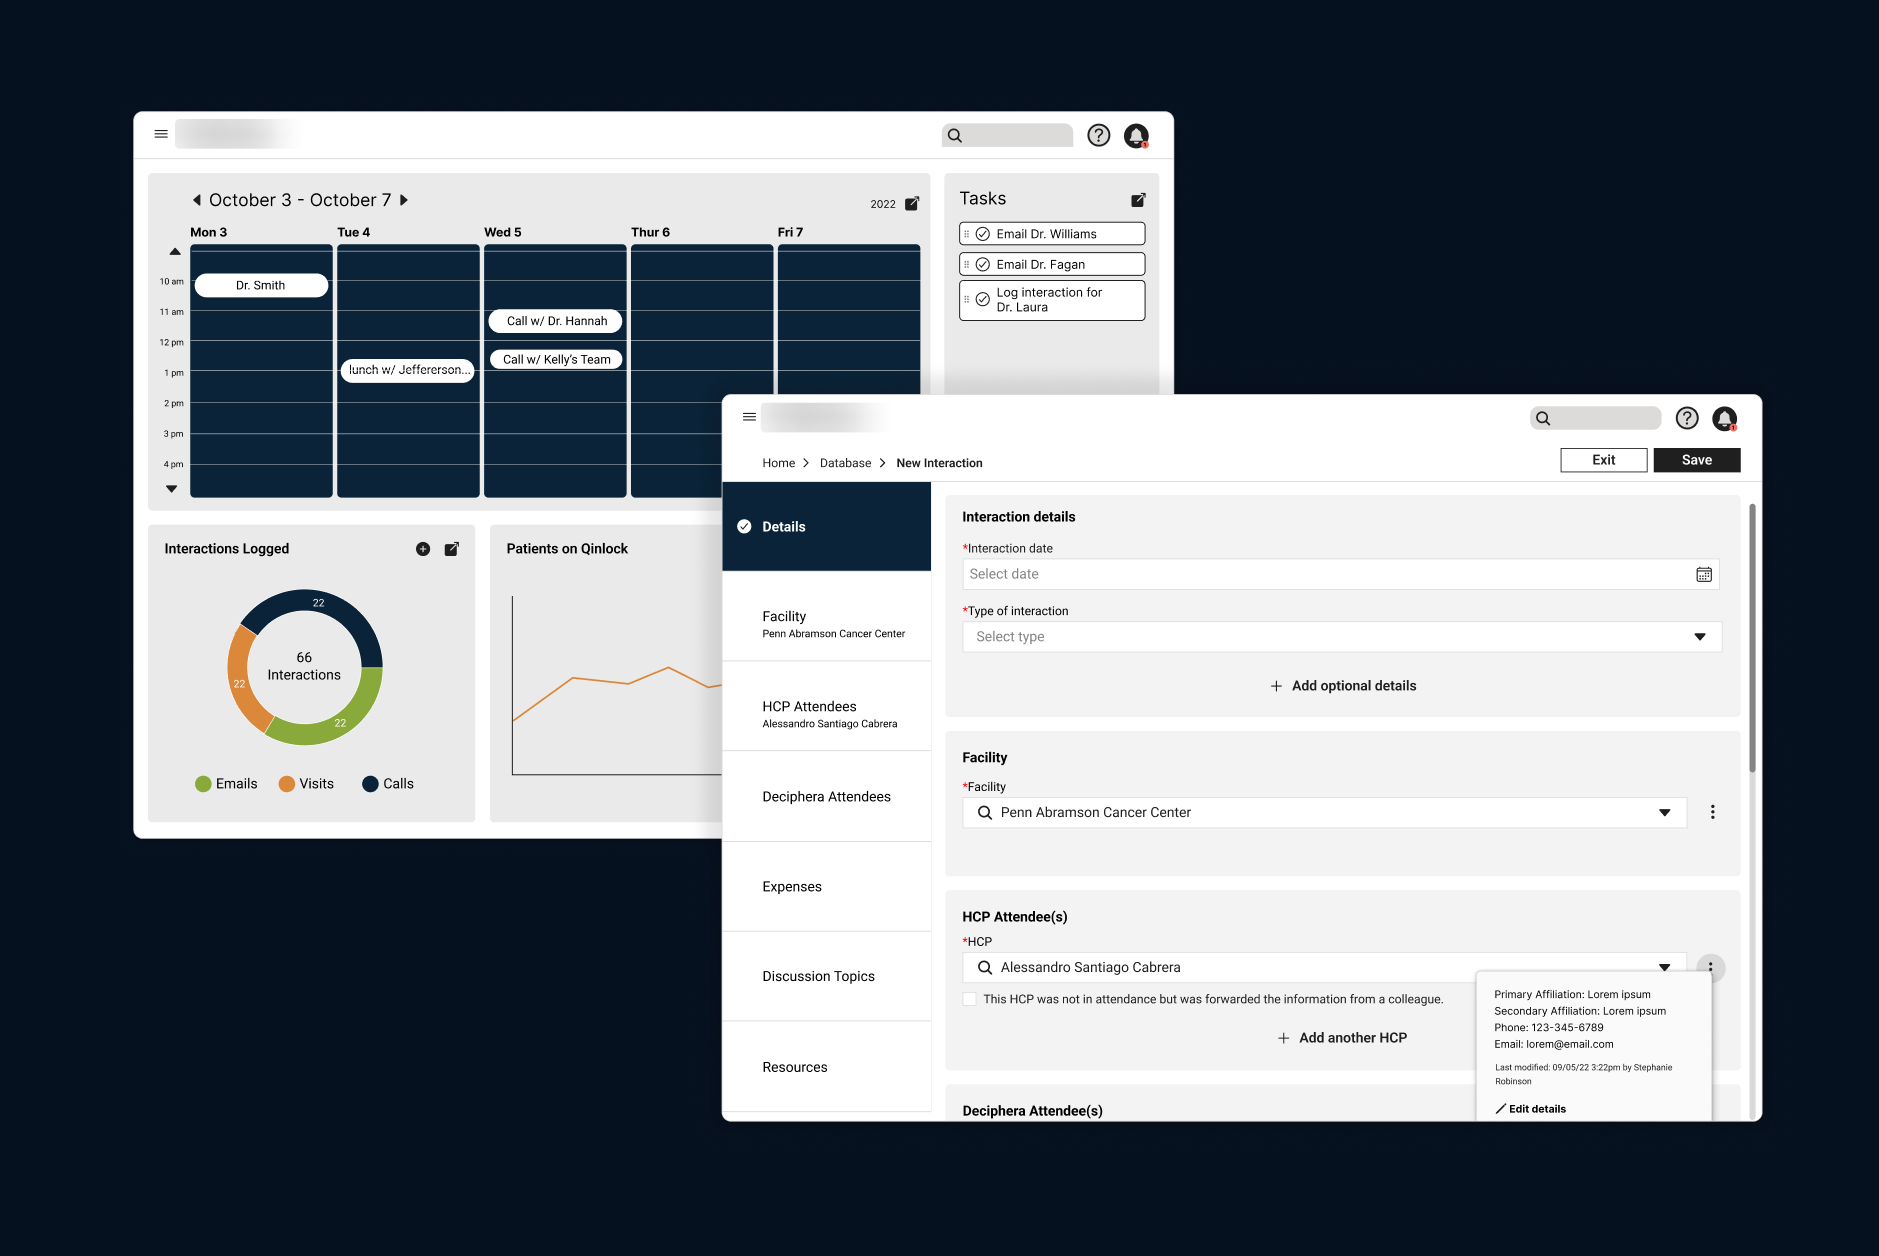
1/9 of the experiences mapped in the tool
Diary Studies
Participants: 4 hosts and 18 participants
Time: 30 minute meeting
Goal
Record authentic experiences in realistic settings and measure the functionality of features.
Record authentic experiences in realistic settings and measure the functionality of features.
Tasks
Each host had to adjust video and audio, screen share, test speakers, join early and play with video layouts. Participants were to act as they normally would.
Each host had to adjust video and audio, screen share, test speakers, join early and play with video layouts. Participants were to act as they normally would.
Assumptions
Hosts would complete all of the tasks but satisfaction would likely be low, especially with specific flows that performed poorly in our evaluations.
Hosts would complete all of the tasks but satisfaction would likely be low, especially with specific flows that performed poorly in our evaluations.
Defining Goal
Analyze the data and generate themes while specifically focusing on quantifying and tracking emotions.
Overarching Process
Build an affinity map from the diary study to generate overarching themes, successes and challenges
Identify the problem found throughout the research methods
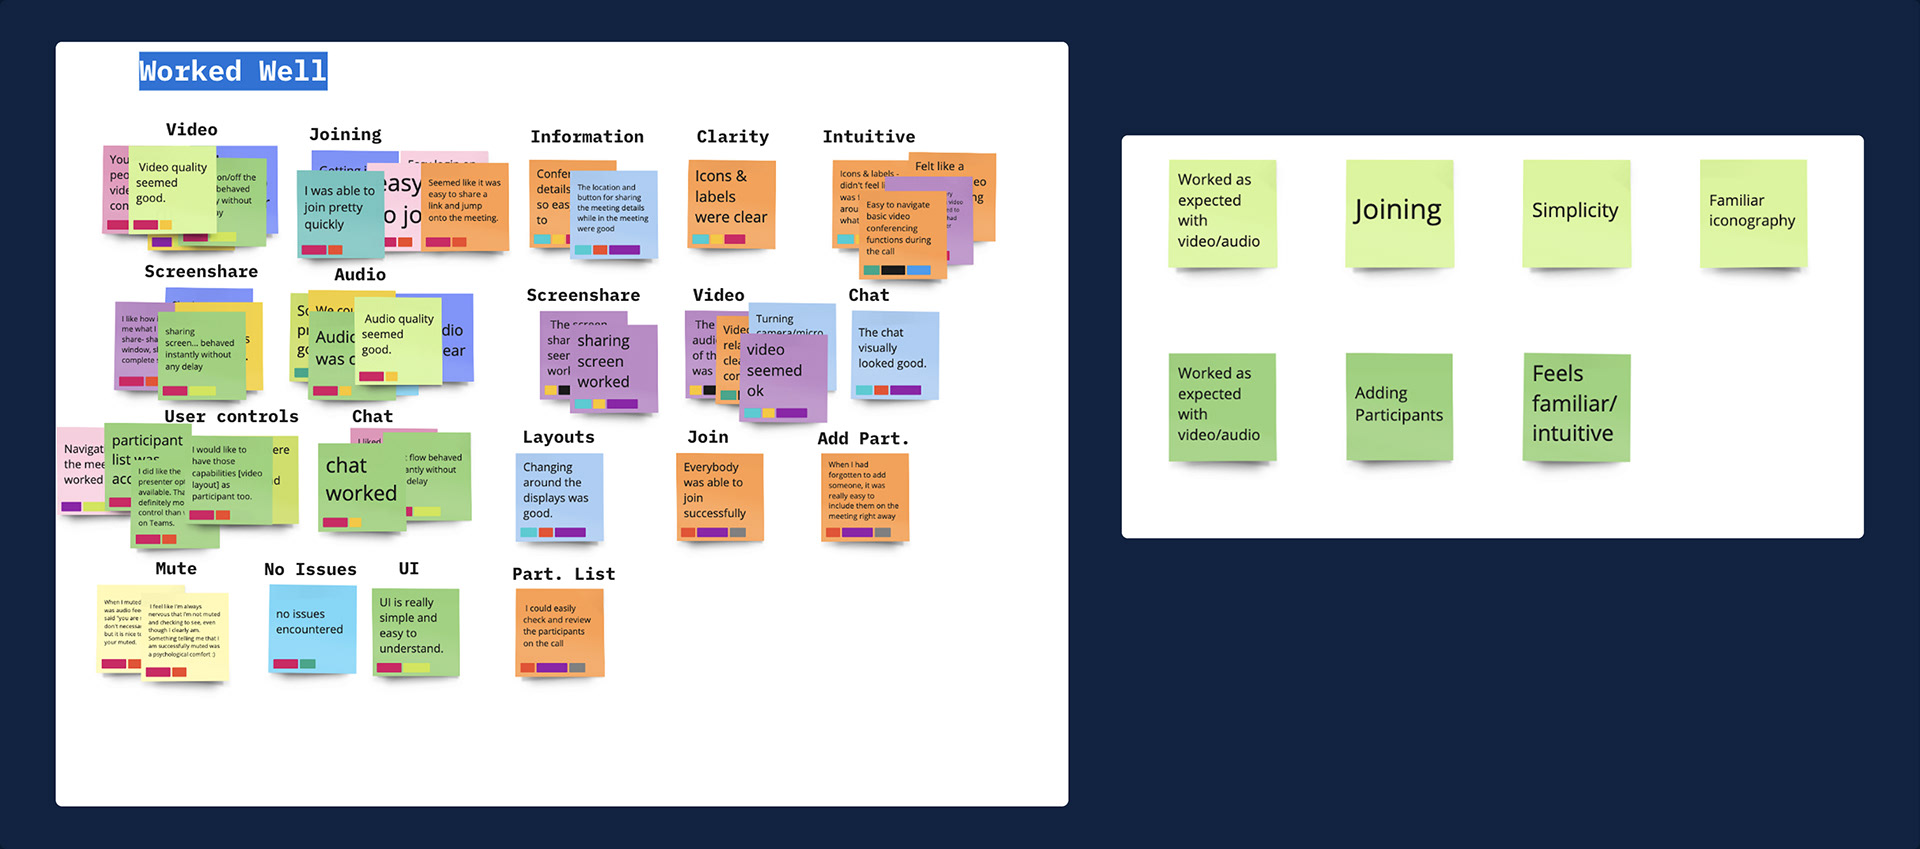
Affinity map of successes from the diary study
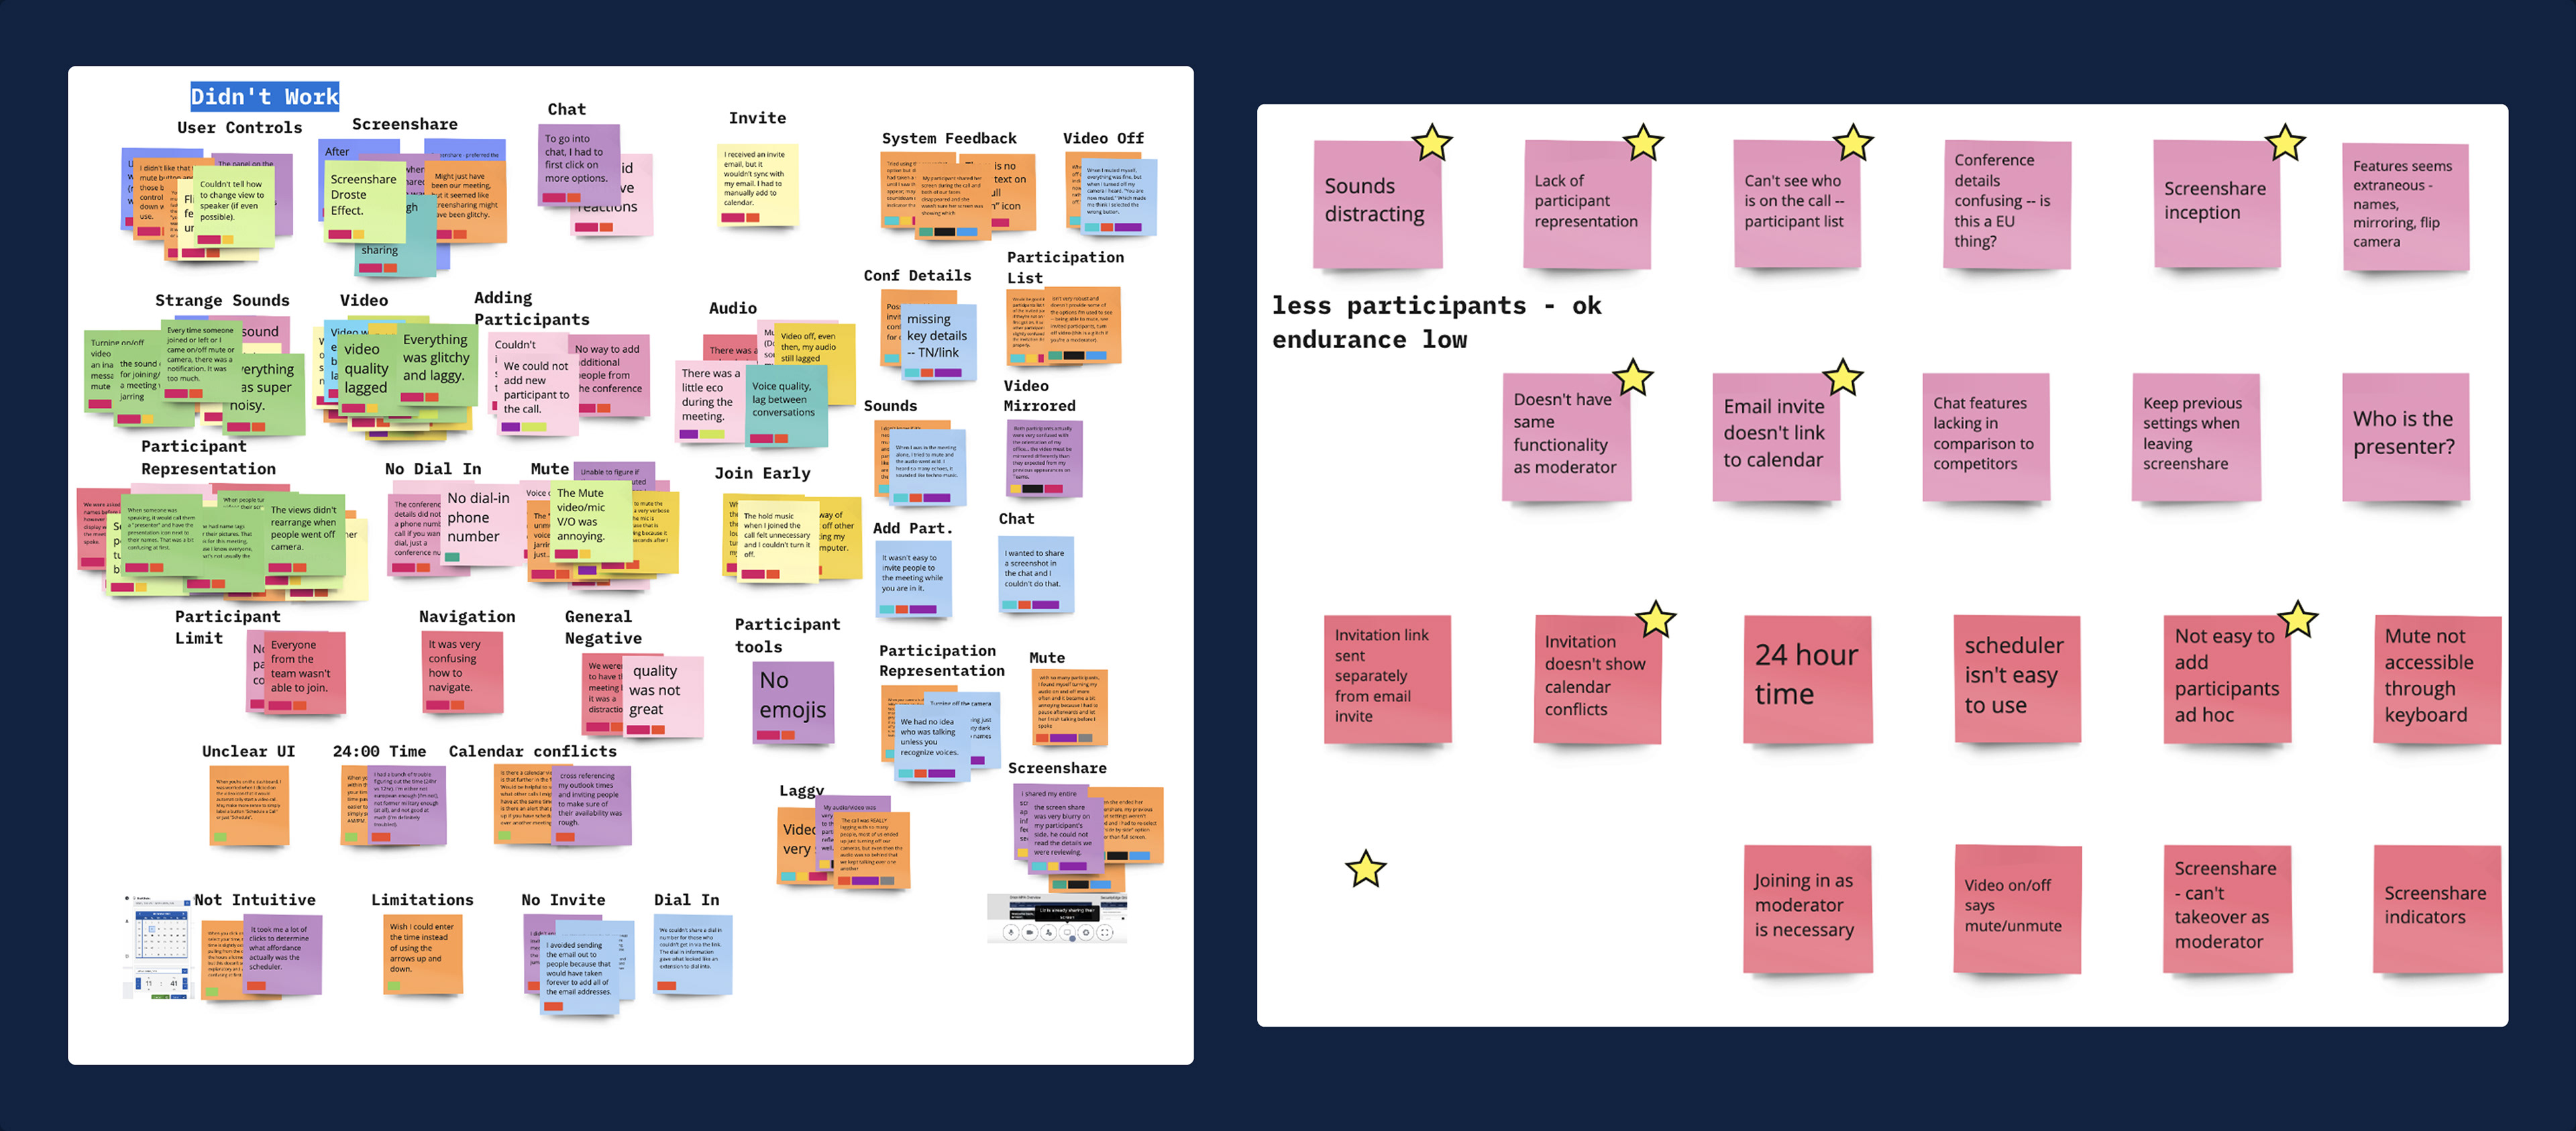
Affinity map of challenges from the diary study
Diary Study Results
While the solution was simple and basic tasks were easy, there were too many distractions from both the host and participant perspective. 86% of people in the diary study wouldn't recommend the tool.
The Problem
Both the heuristic violations and observations in the diary study conclude that the conferencing tool feels unfinished, overly complex and hard to predict. Compared to competitors, this tool has a low advantage in an established environment with simple alternatives.
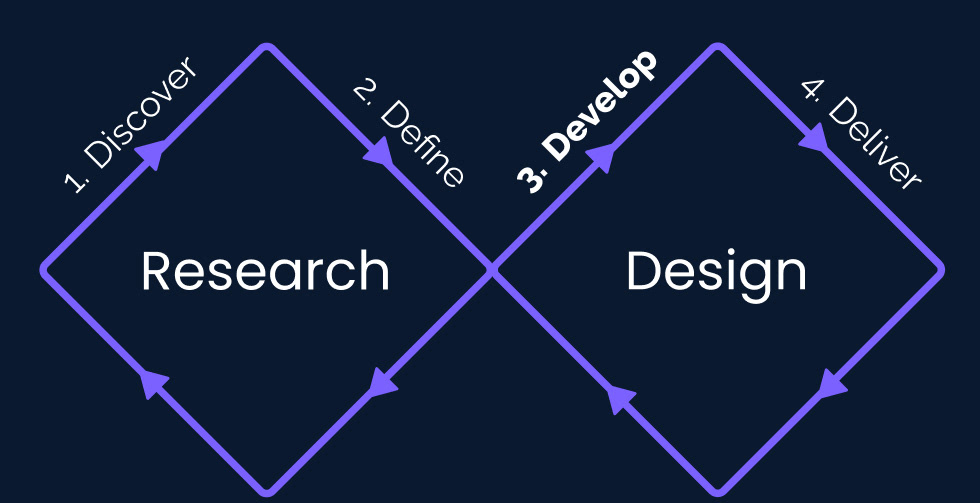
Develop Goal
Translate the data into a visual that was comprehensive and easy to follow so that stakeholders could rely on it to help formulate a roadmap
Overarching Process
Brainstorm various ways to create the layout of the map
Use prototyping to build interactive data to better show the qualitative points
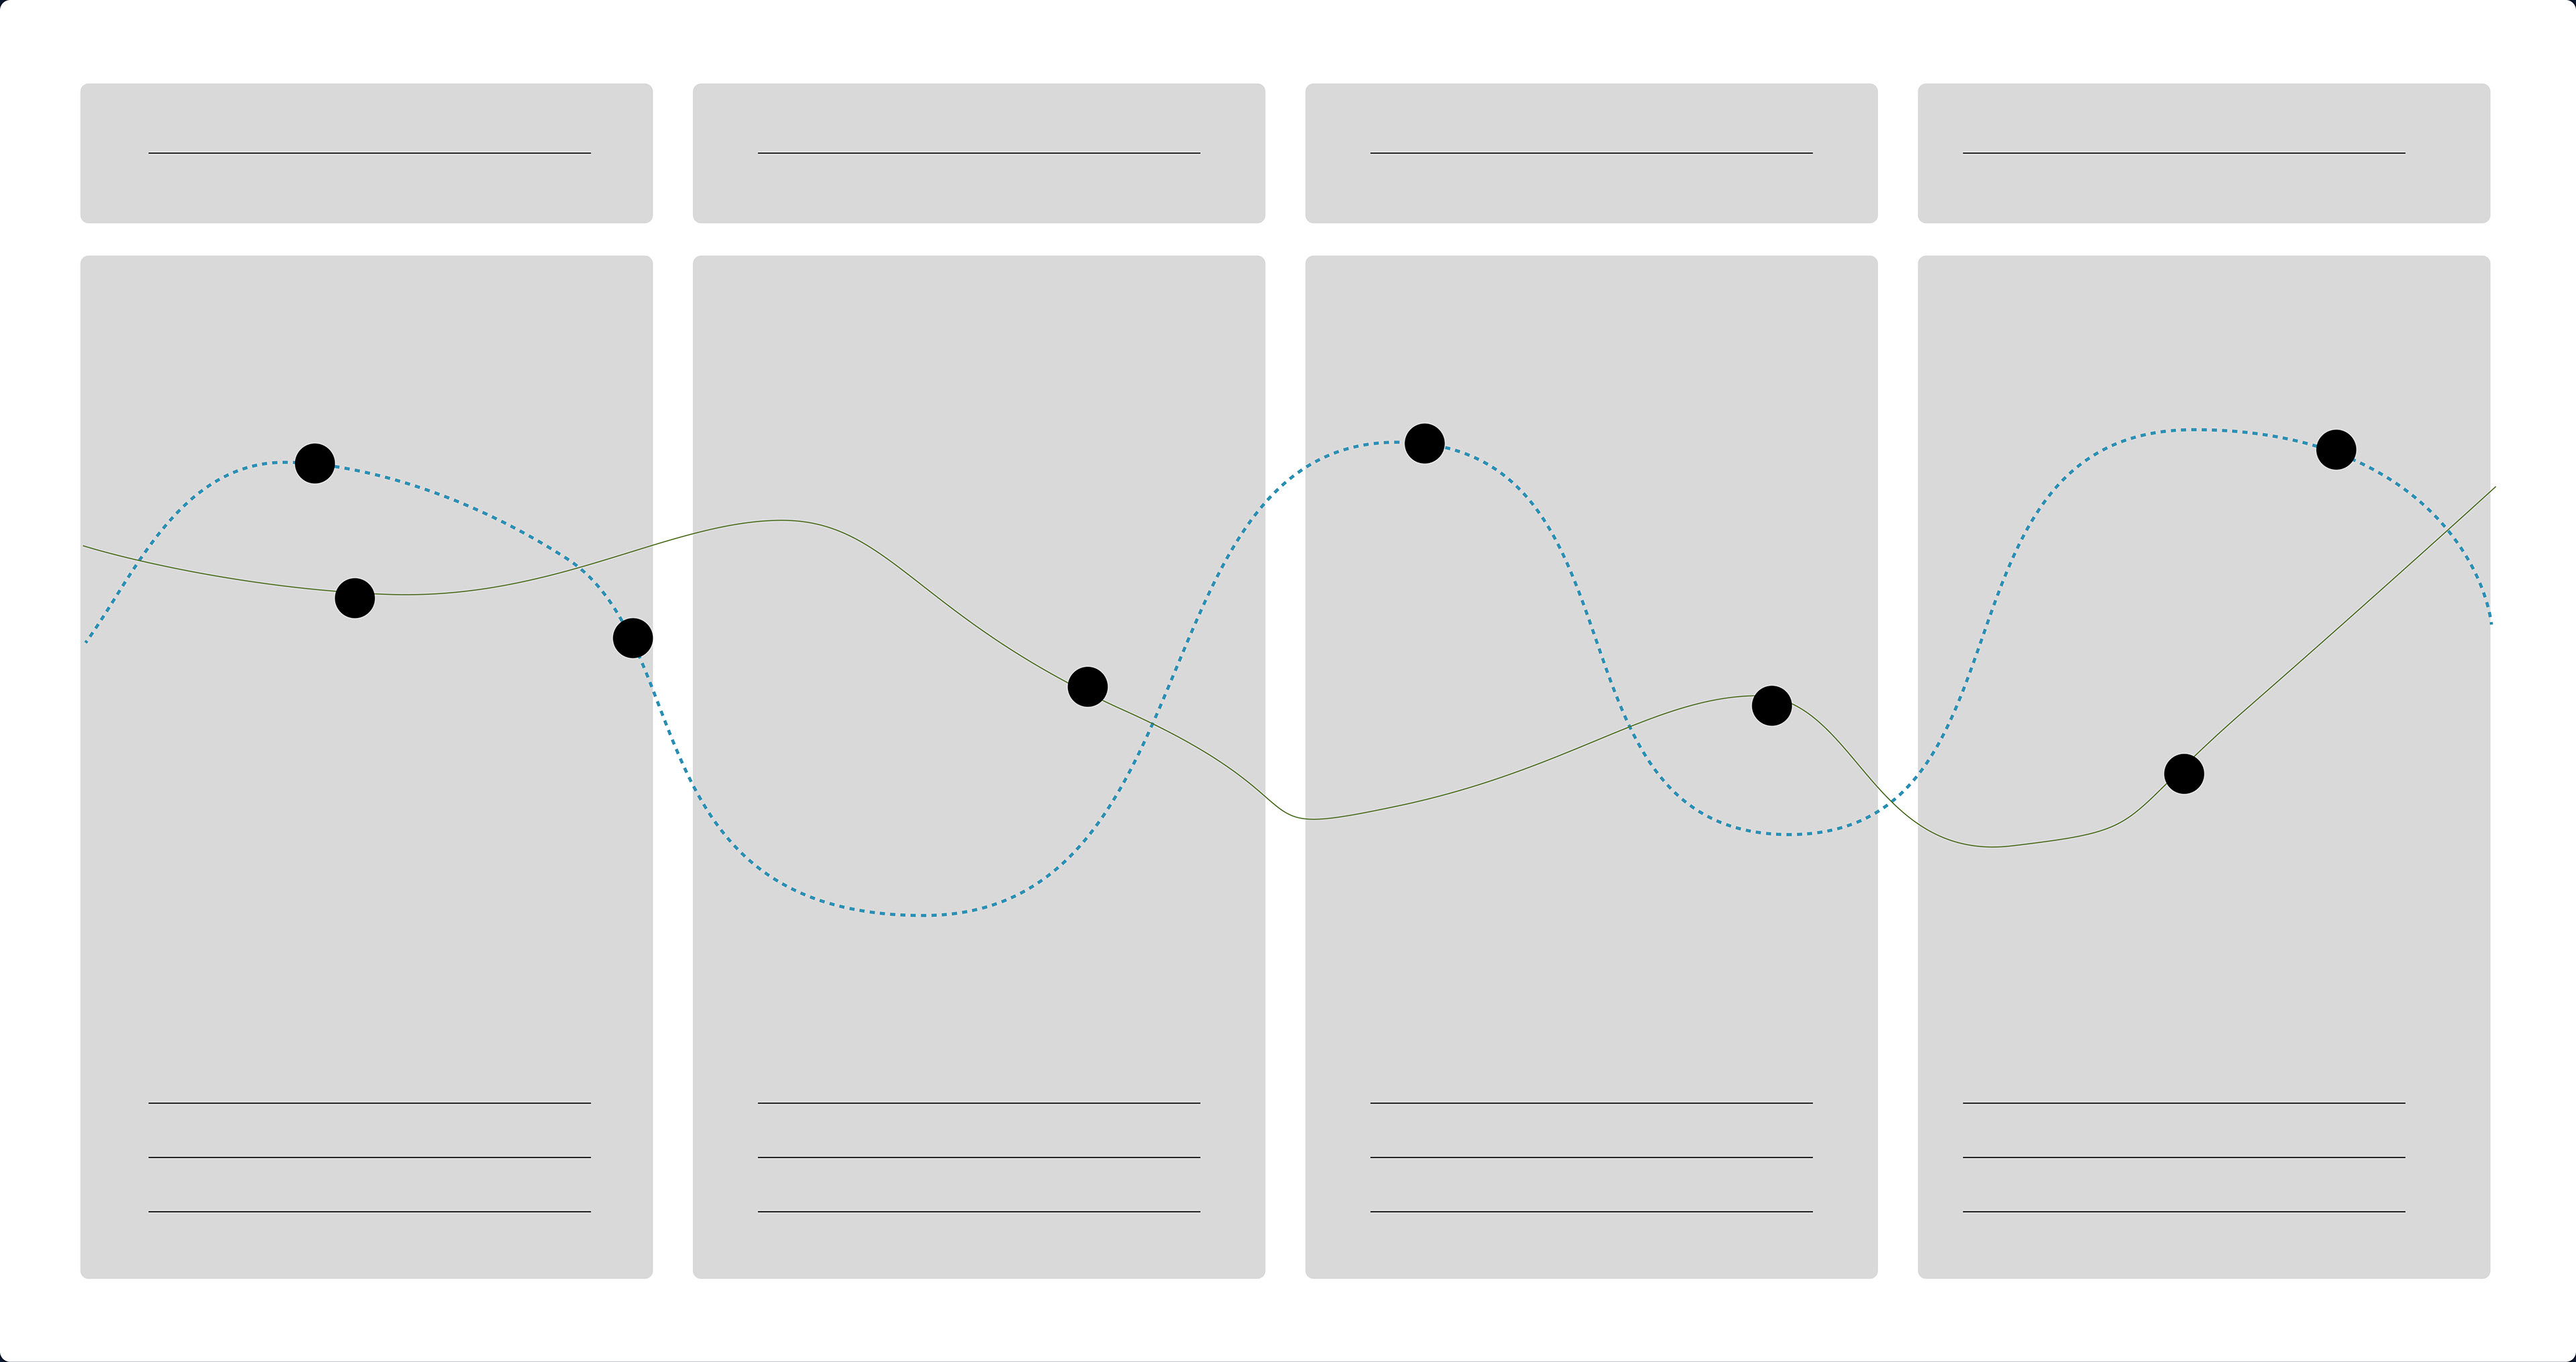
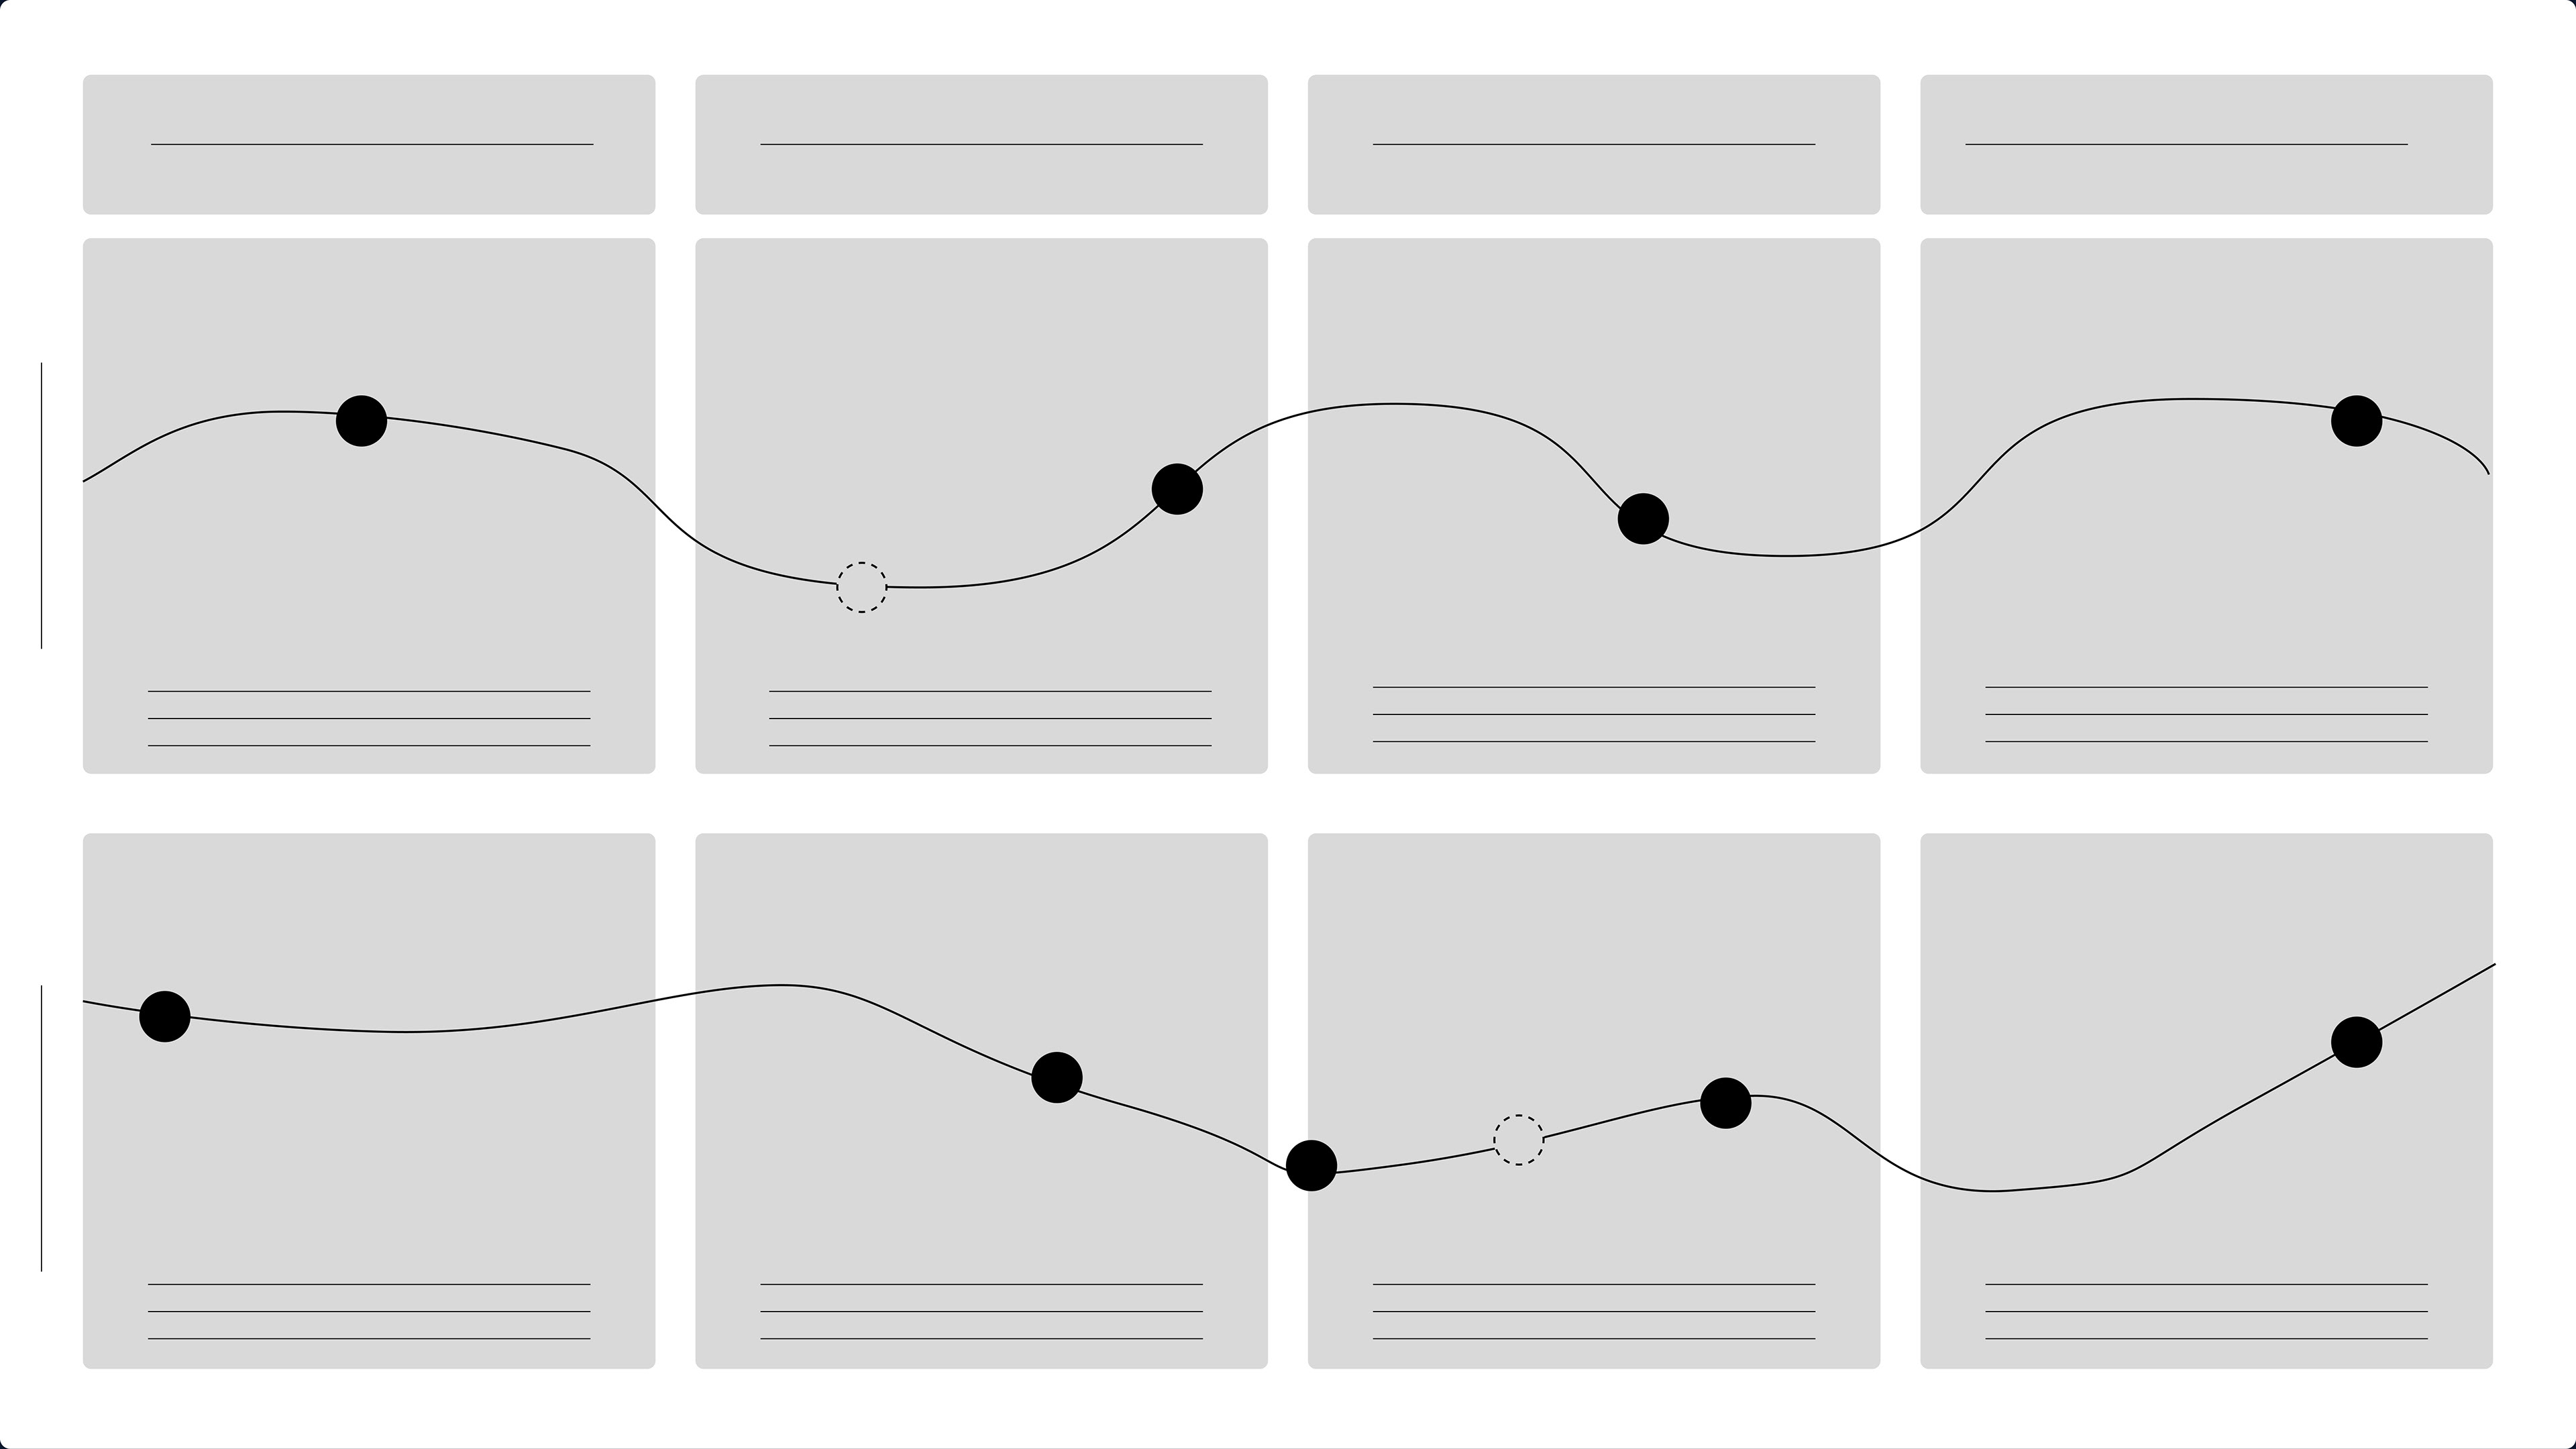
Idea #1
Idea #1: A Traditional Journey Map
I wanted a clean layout to differentiate between the data sets for both user and host. While the emotional journey was simple, I found the evidence for those points too hard to visualize for each group. I knew it was quickly going to get too overwhelming.
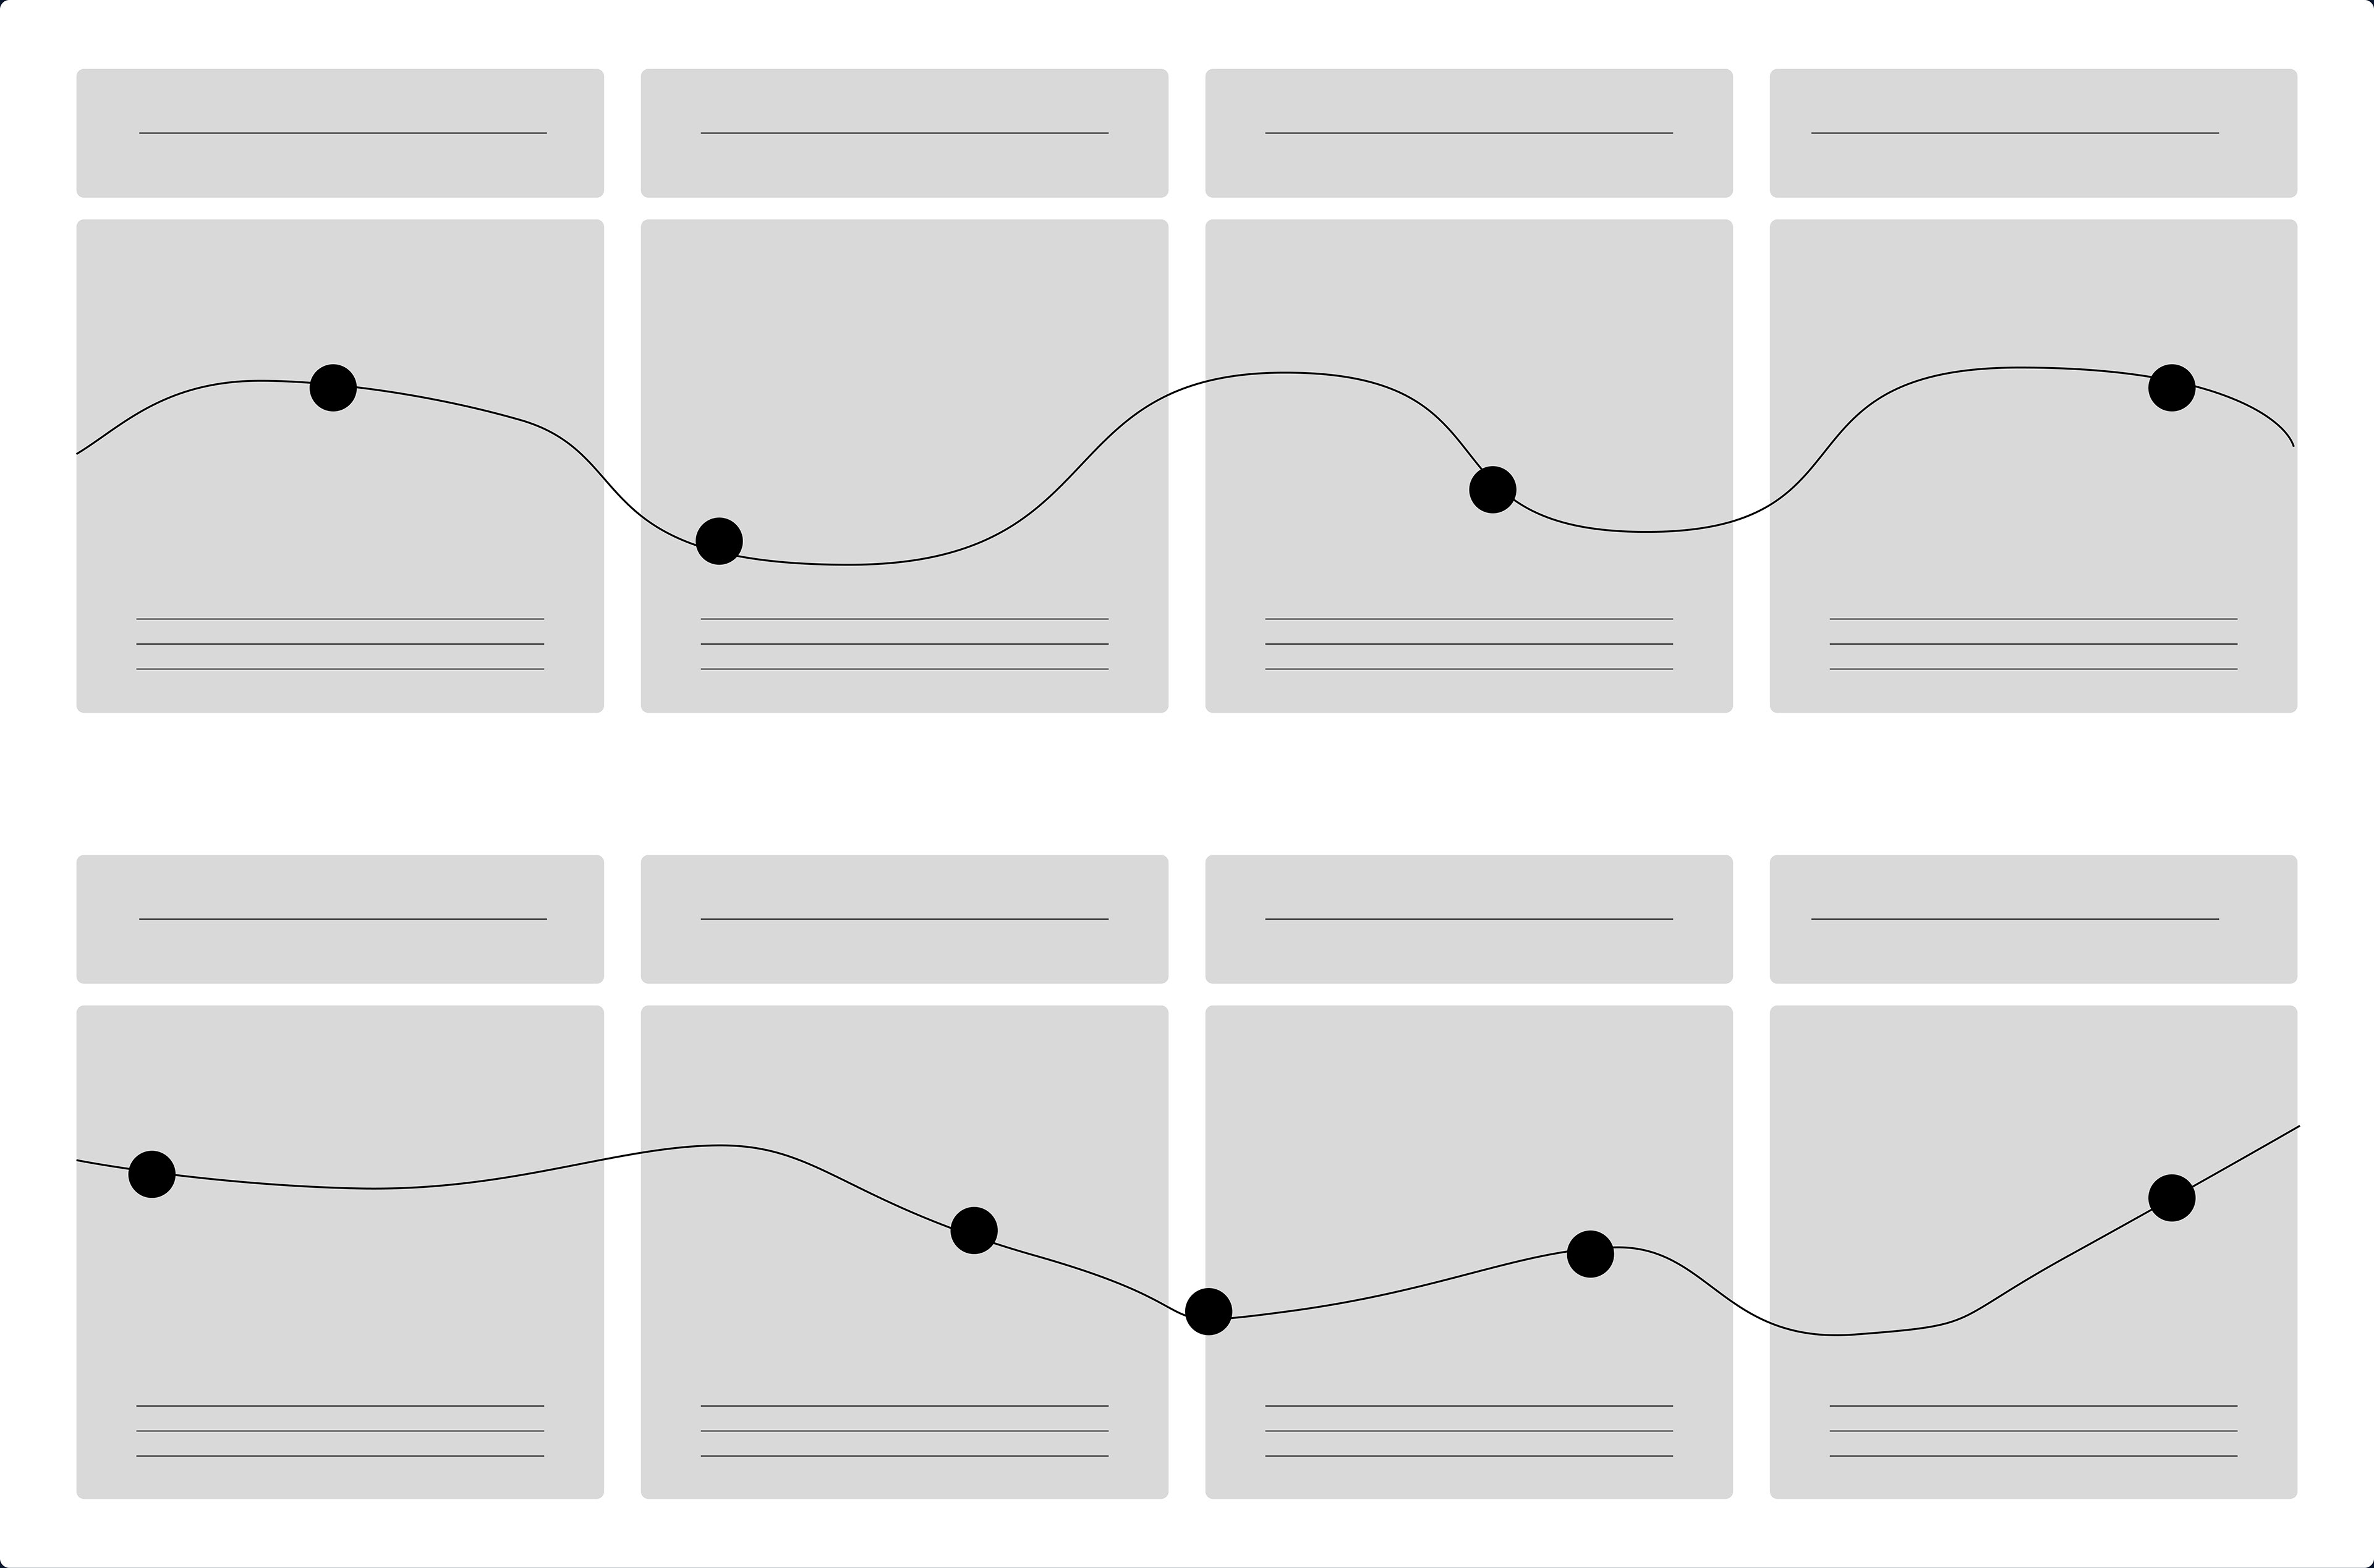
Idea #2
Idea #2 : Different Maps
Next I wanted to try to make the content digestible and promote data comprehension. However, the map felt redundant and listing the same steps twice felt like a waste of real estate so I thought it could be simplified.
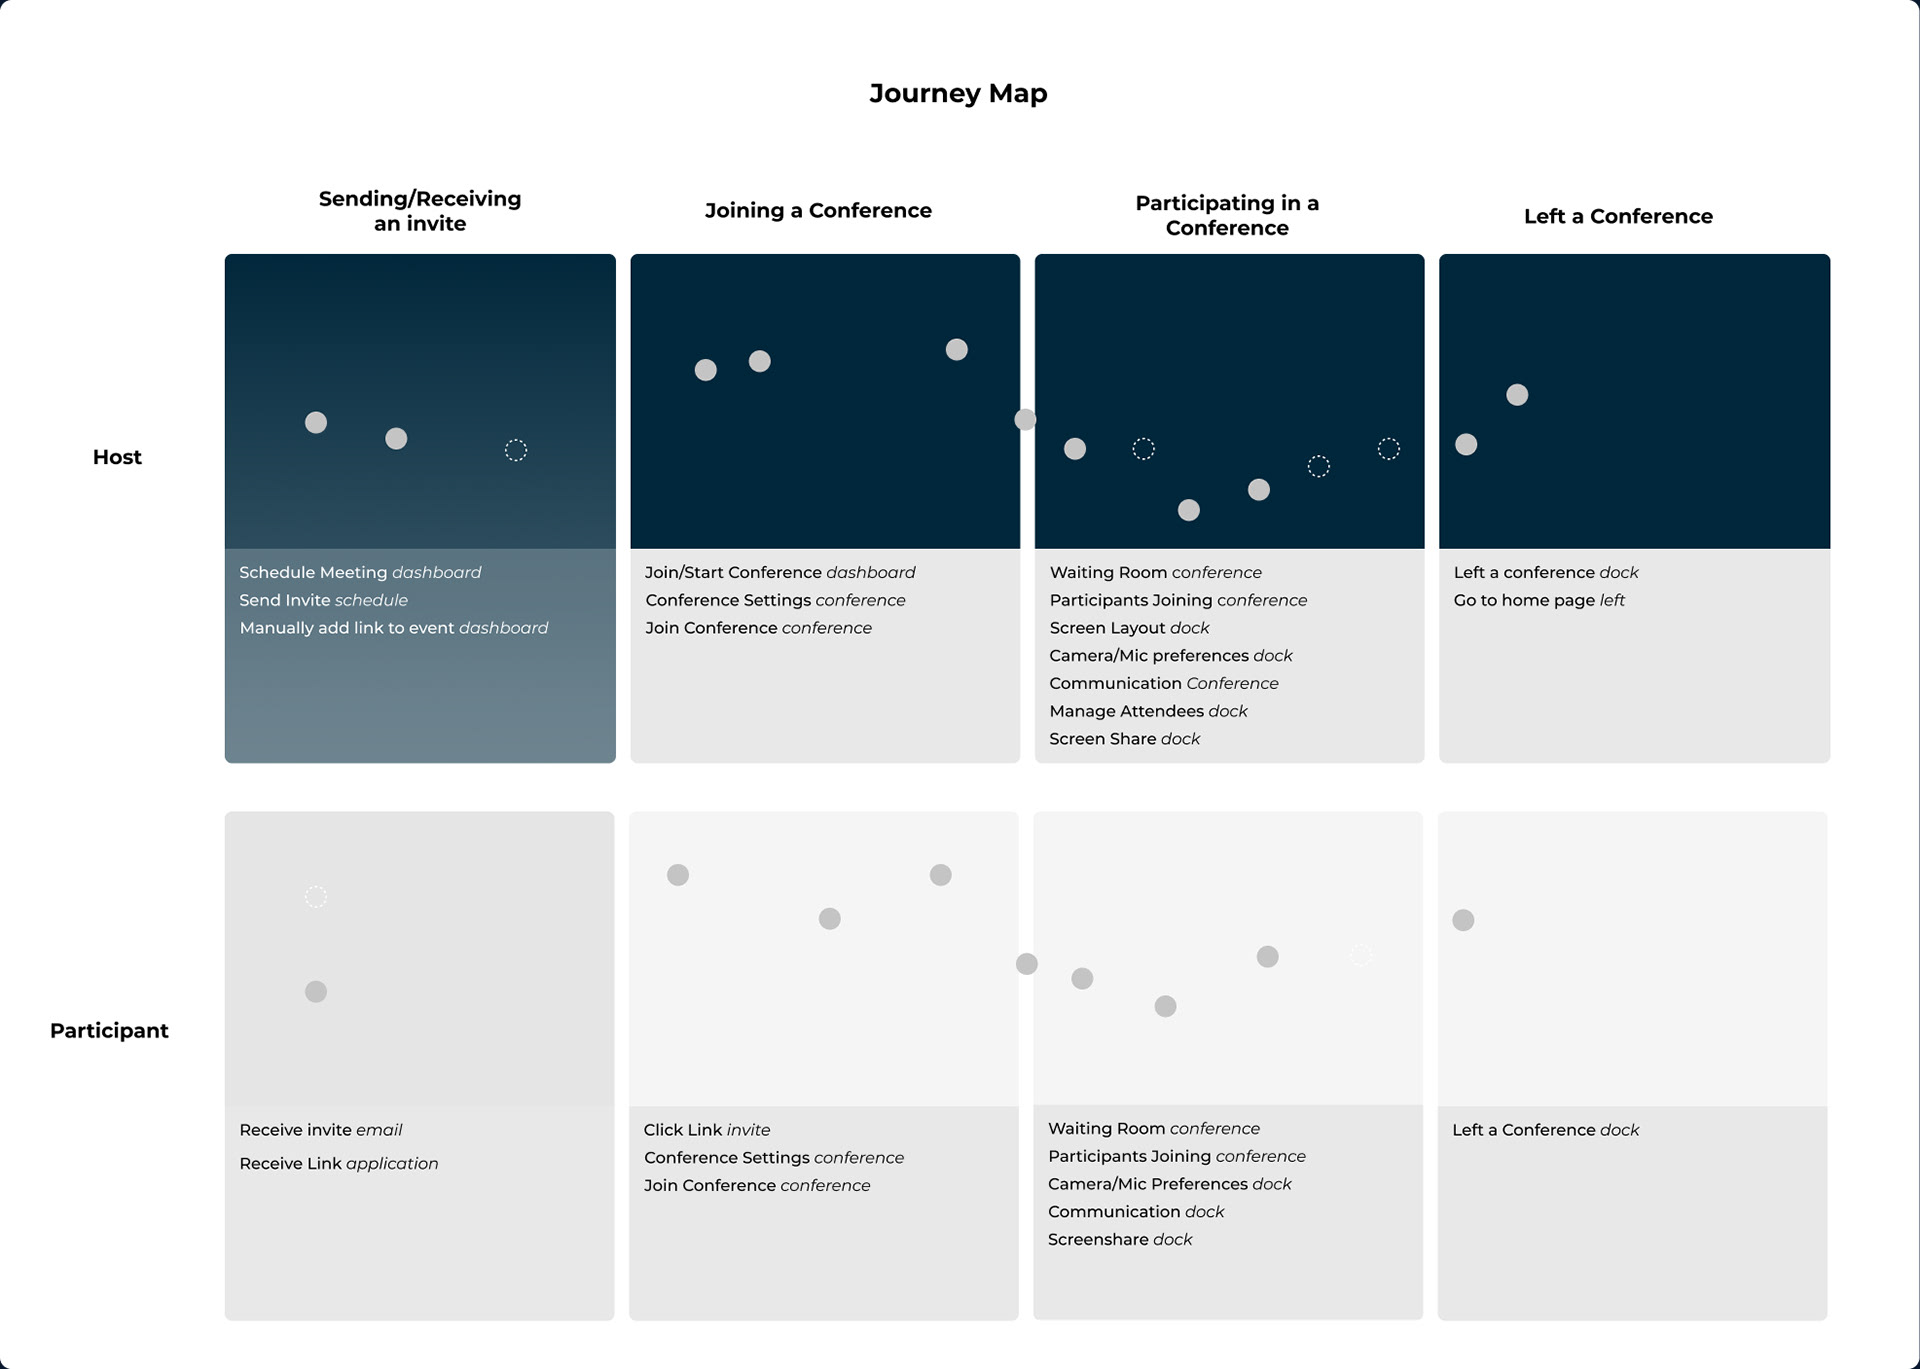
Idea #3
Idea #3: A Blend
Finally, I combined the separate experiences under the same step to save on real estate and to help with data cross-analyses between hosts and participants. This worked.
Playing with UI
Figuring Out UI
After the structure was chosen I needed to figure out UI and begin to map data points. Upon receiving feedback on the color I ended up going with a navy blue.
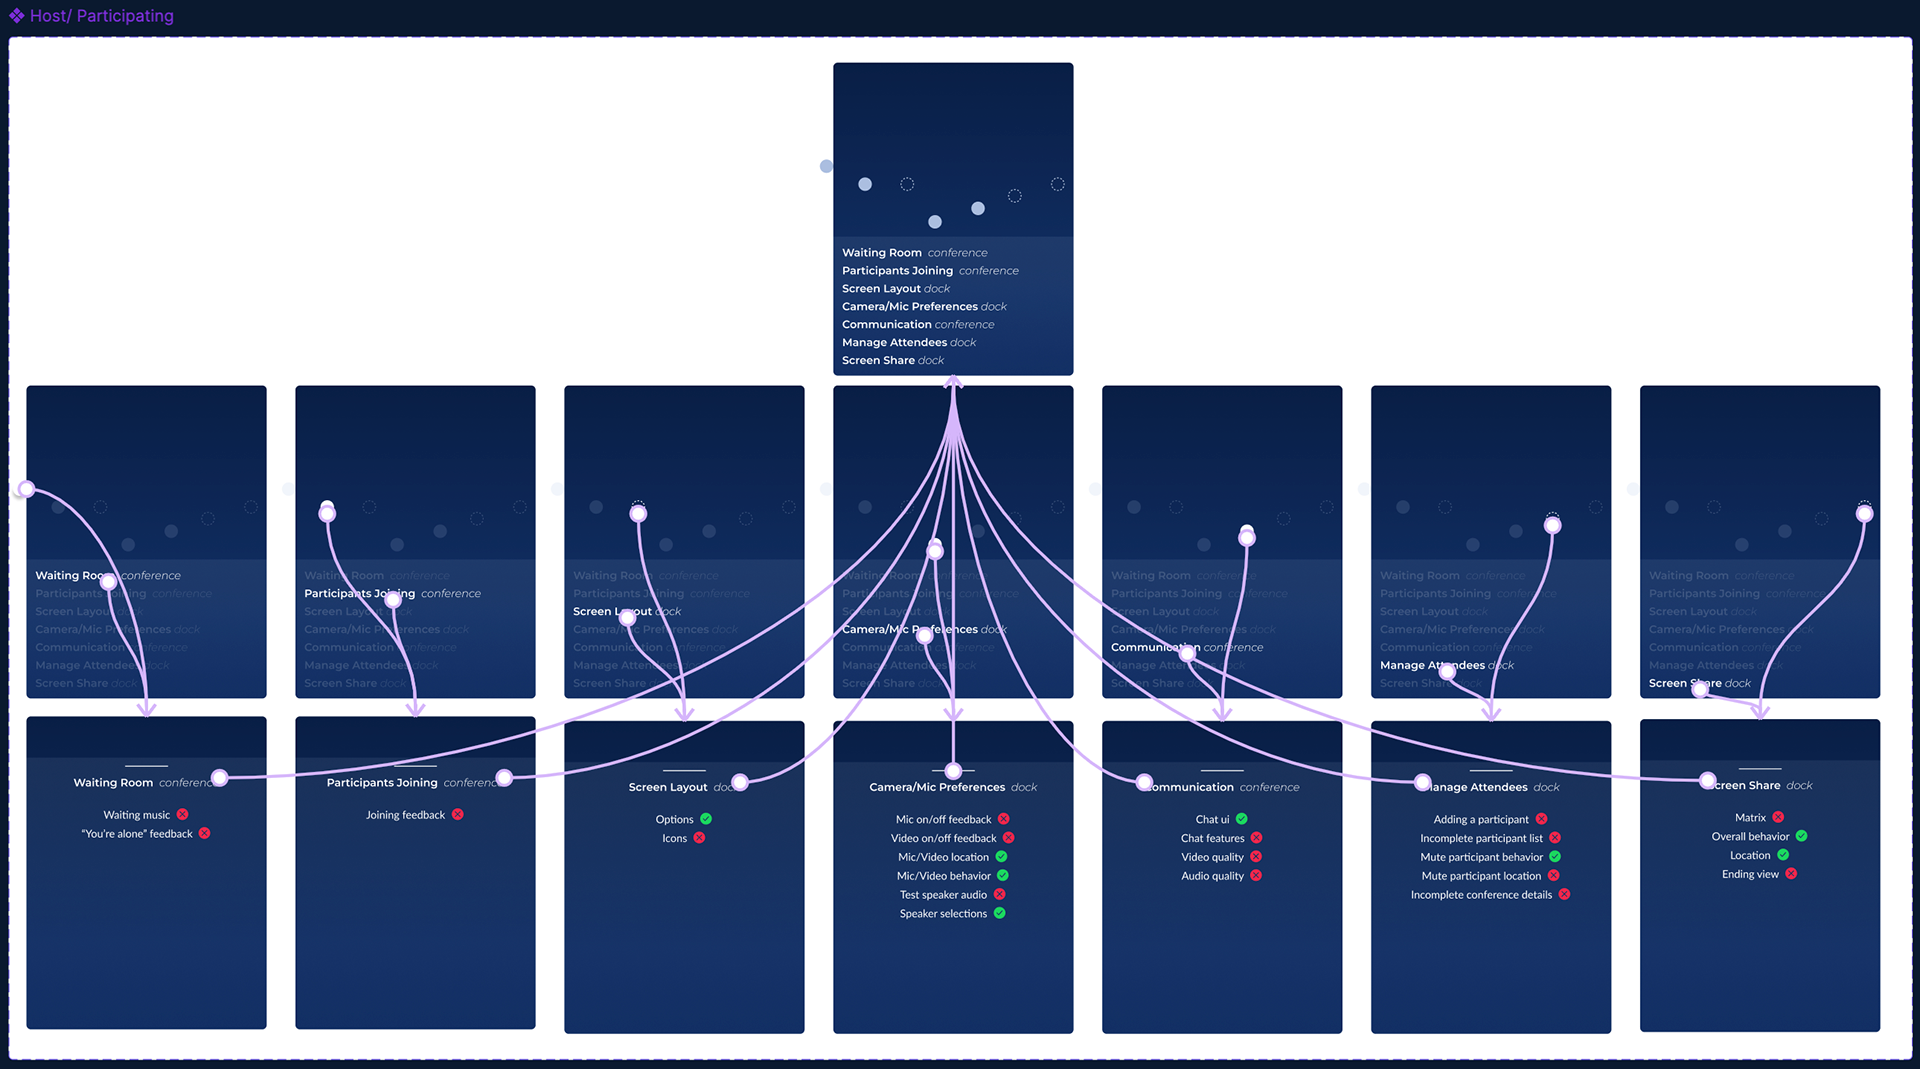
Prototyped interactions
Prototyping Interactive Data
After determining the UI, I had to find the correct amount of data interaction. I tried to make the entire map an interactive component but ended up building out individual card components for the host and participant.
Delivering Goal
Effectively communicate findings to stakeholders to use for a future product roadmap
Overarching Process
Communicate how to interpret different data visualizations
Clearly document all research and design for stakeholders in a deck for reference

Reflections & Challenges
Add External Participants
We only used internal customers to review the product and it would've provided more data and controlled for bias if we added in participants unfamiliar with the acquisition or tool.
We only used internal customers to review the product and it would've provided more data and controlled for bias if we added in participants unfamiliar with the acquisition or tool.
Participating in Strategy
This research was handed off without further discussion of roadmap planning or resource strategy. If we were apart of future conversations we would've been able to further structure the data and plan for feature releases around upcoming quarterly goals.
This research was handed off without further discussion of roadmap planning or resource strategy. If we were apart of future conversations we would've been able to further structure the data and plan for feature releases around upcoming quarterly goals.